Monitoring Task Duration Time
Overview
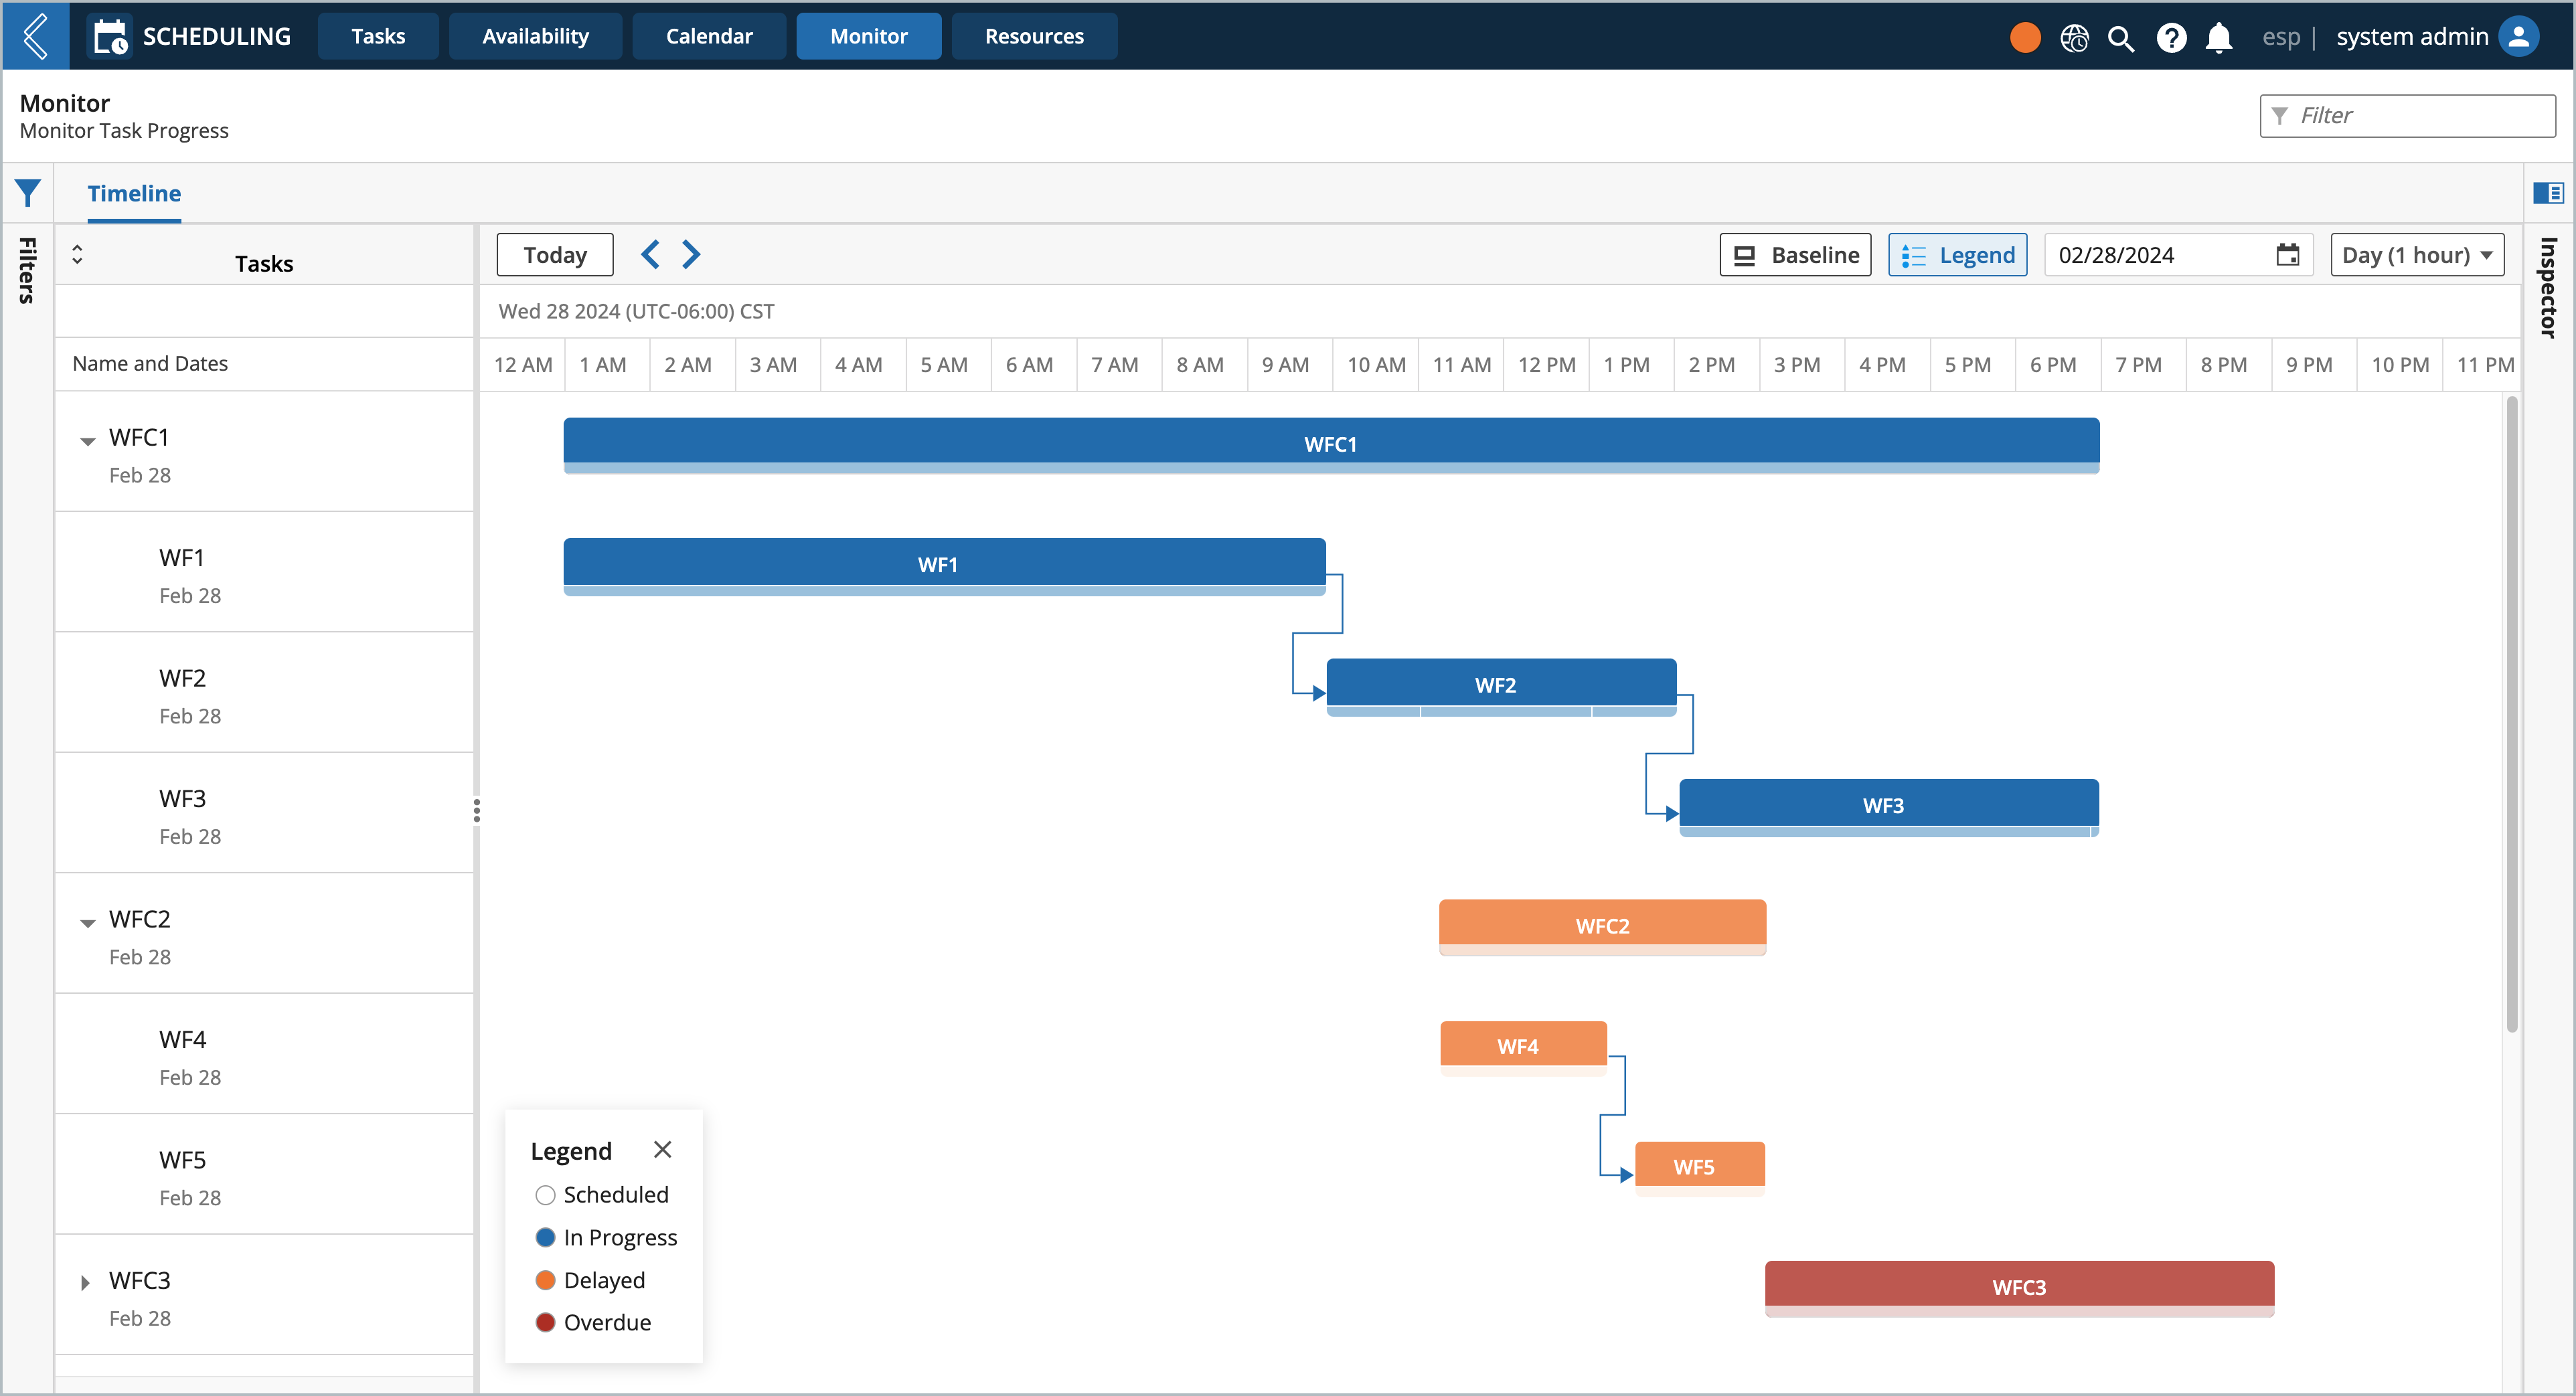
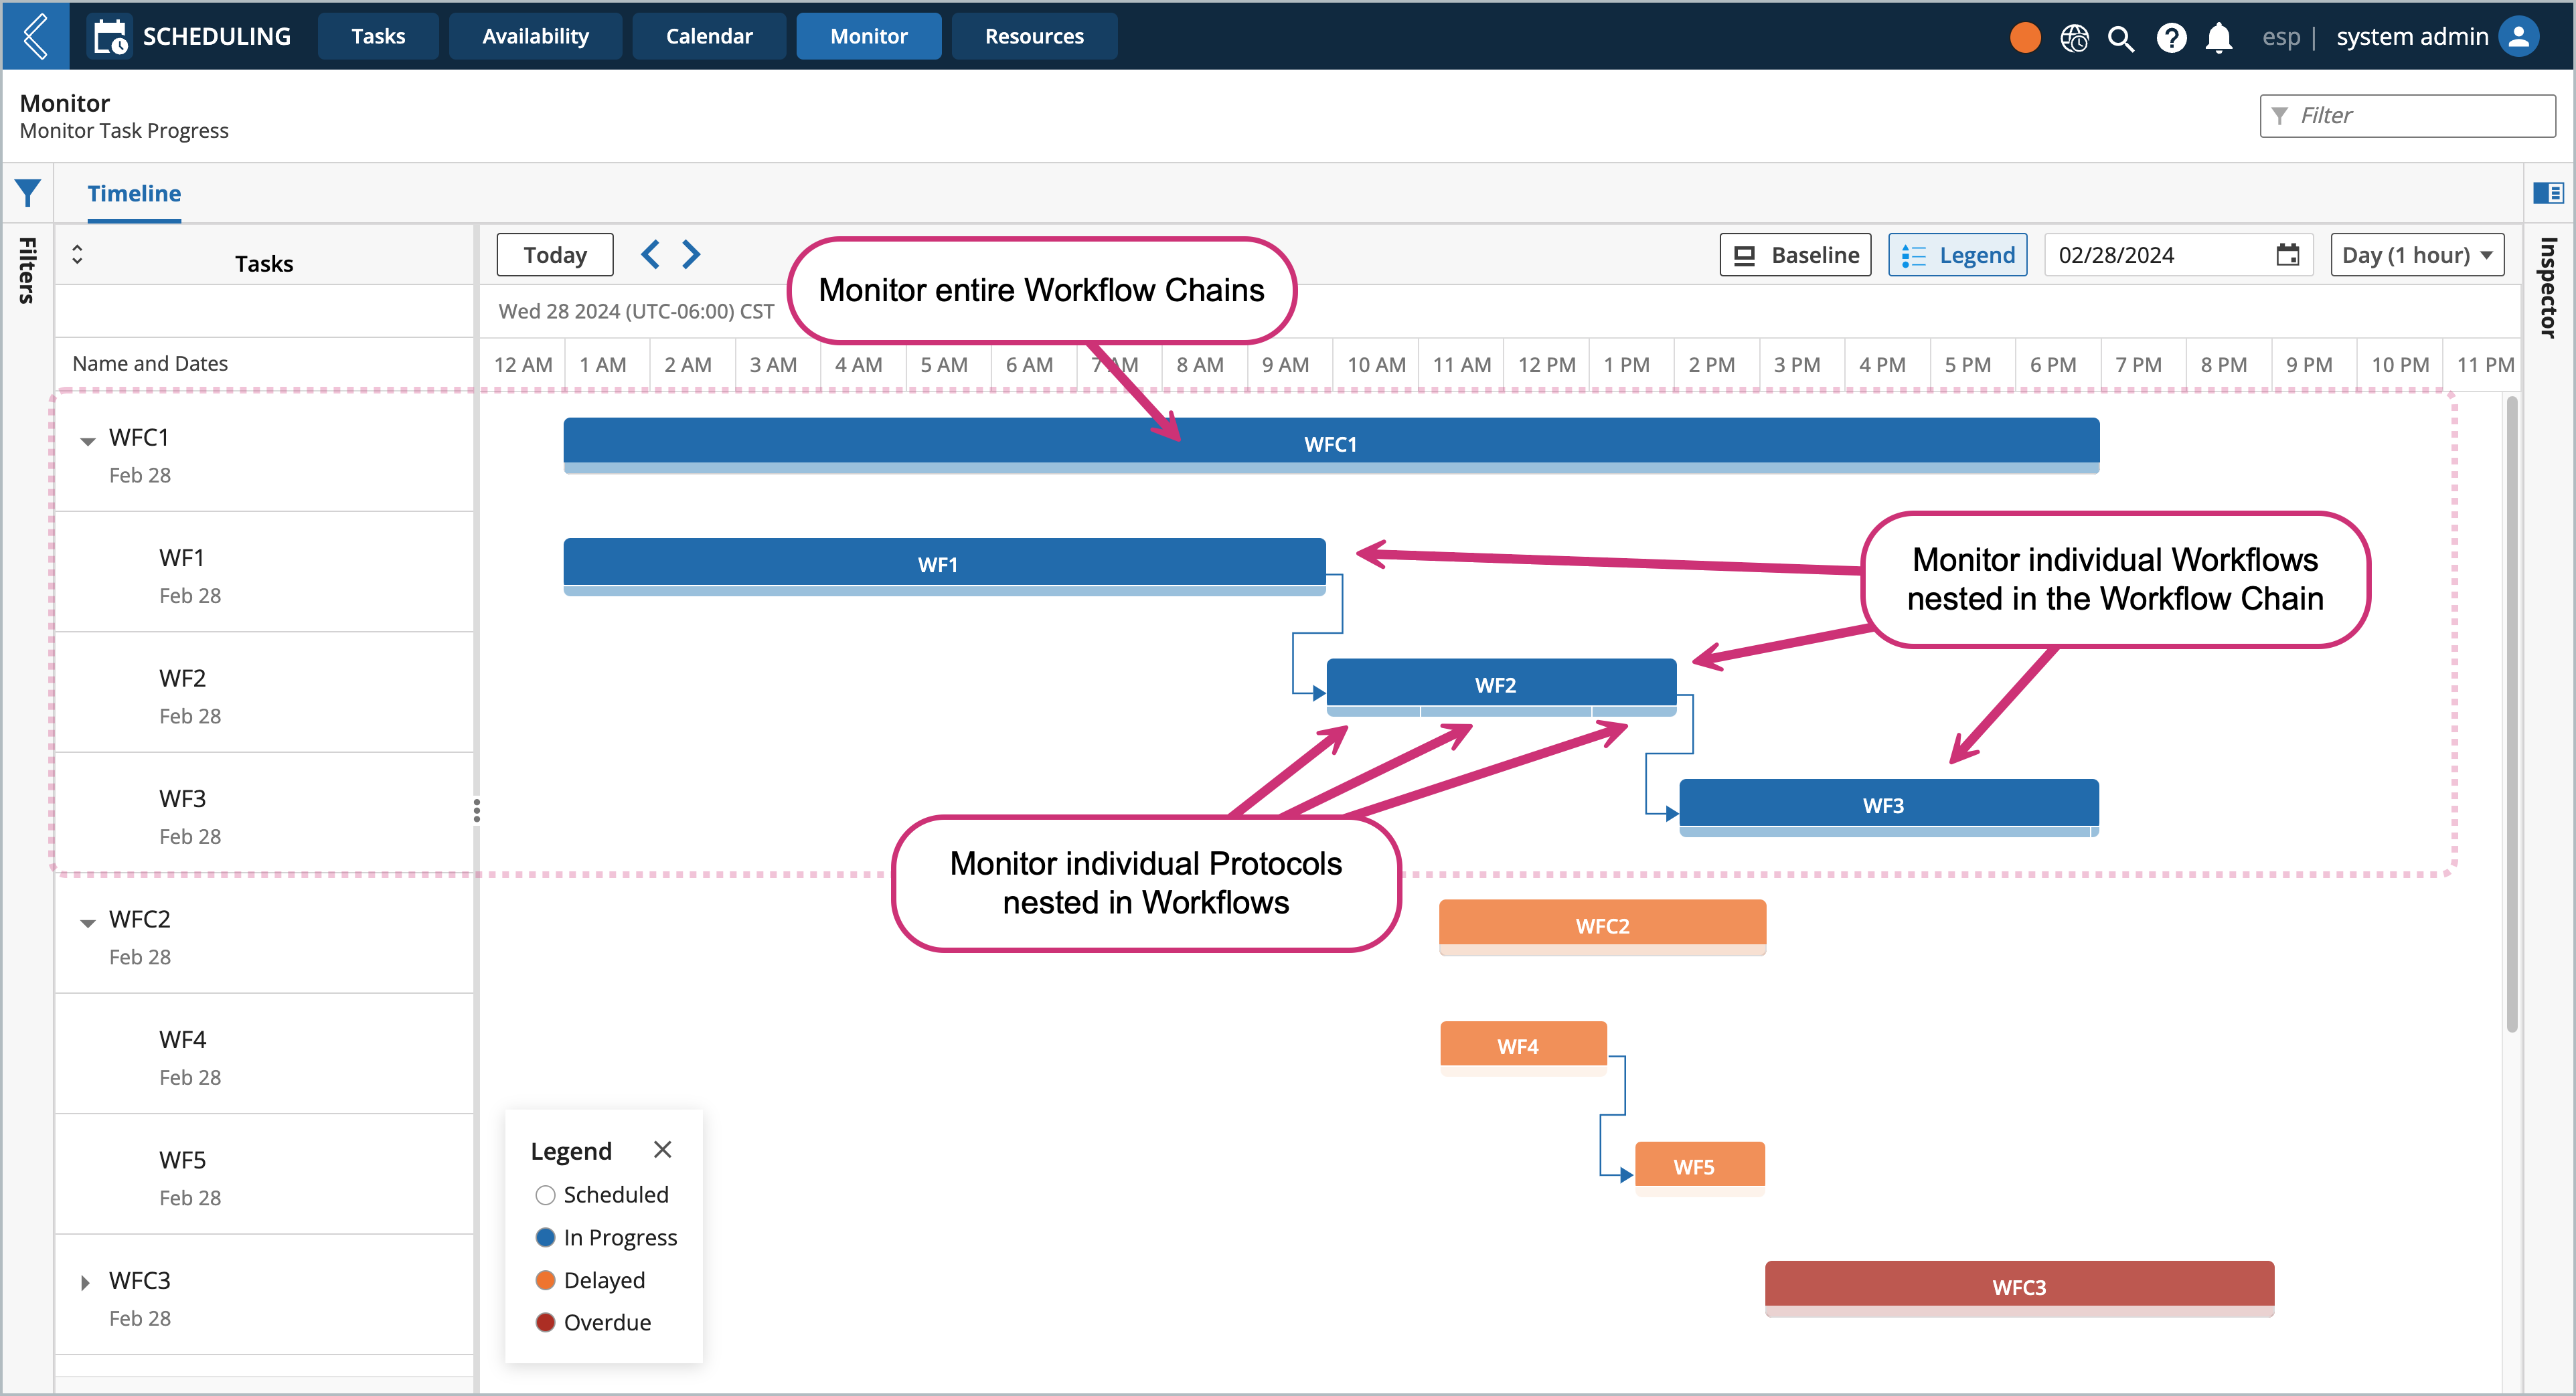
As process related tasks are being ran, you can monitor their progress in real-time. The L7 Scheduling's Monitor page tracks real-time progress and compares it to the expected baseline time and due date. Tasks can be monitored from the Workflow Chain level, down to the Protocol level. The color coded tasks allow you to quickly identify which tasks are scheduled, in progress, delayed, and overdue.
Navigating the Timeline
Color-Coded Tasks
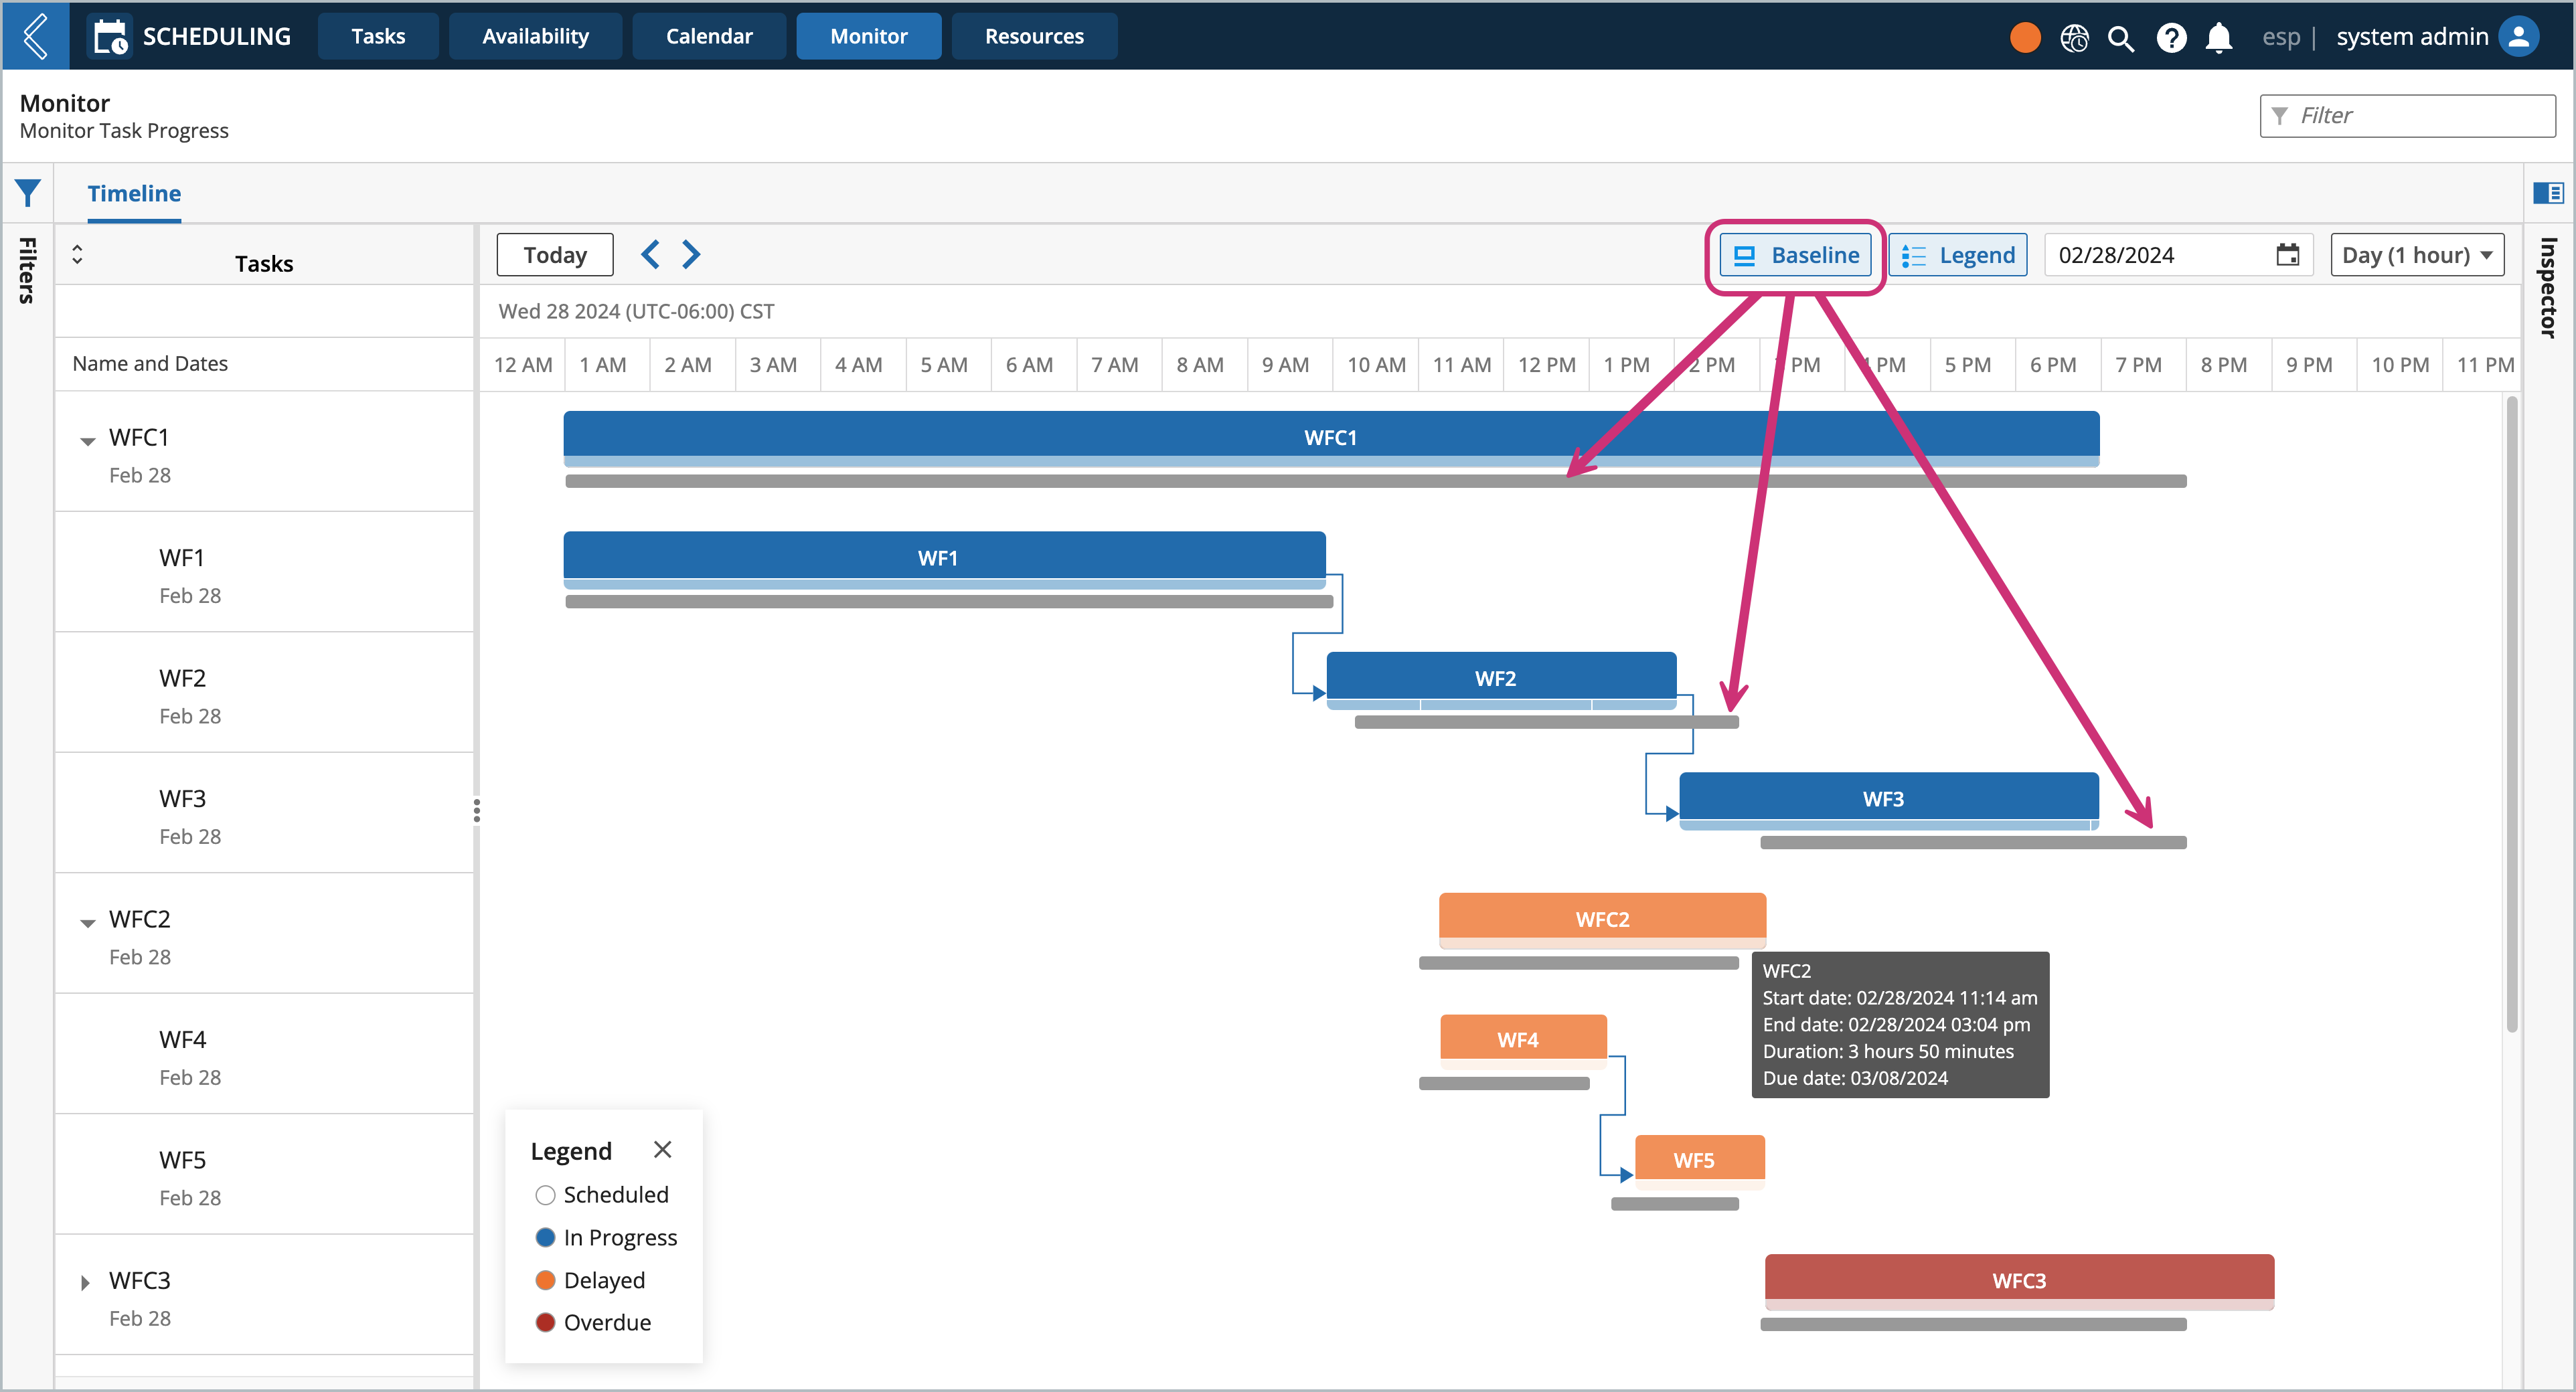
The Timeline Gantt charts are color-coded to provide you quick updates about the progress of any task. Color coding is determined from both the baseline expectation and the assigned due date. A legend is included which contains the following task information:
White tasks are scheduled and pending
Blue tasks are in progress and on time
Orange tasks are delayed
Red tasks that are overdue
Adjustable Calendar Views
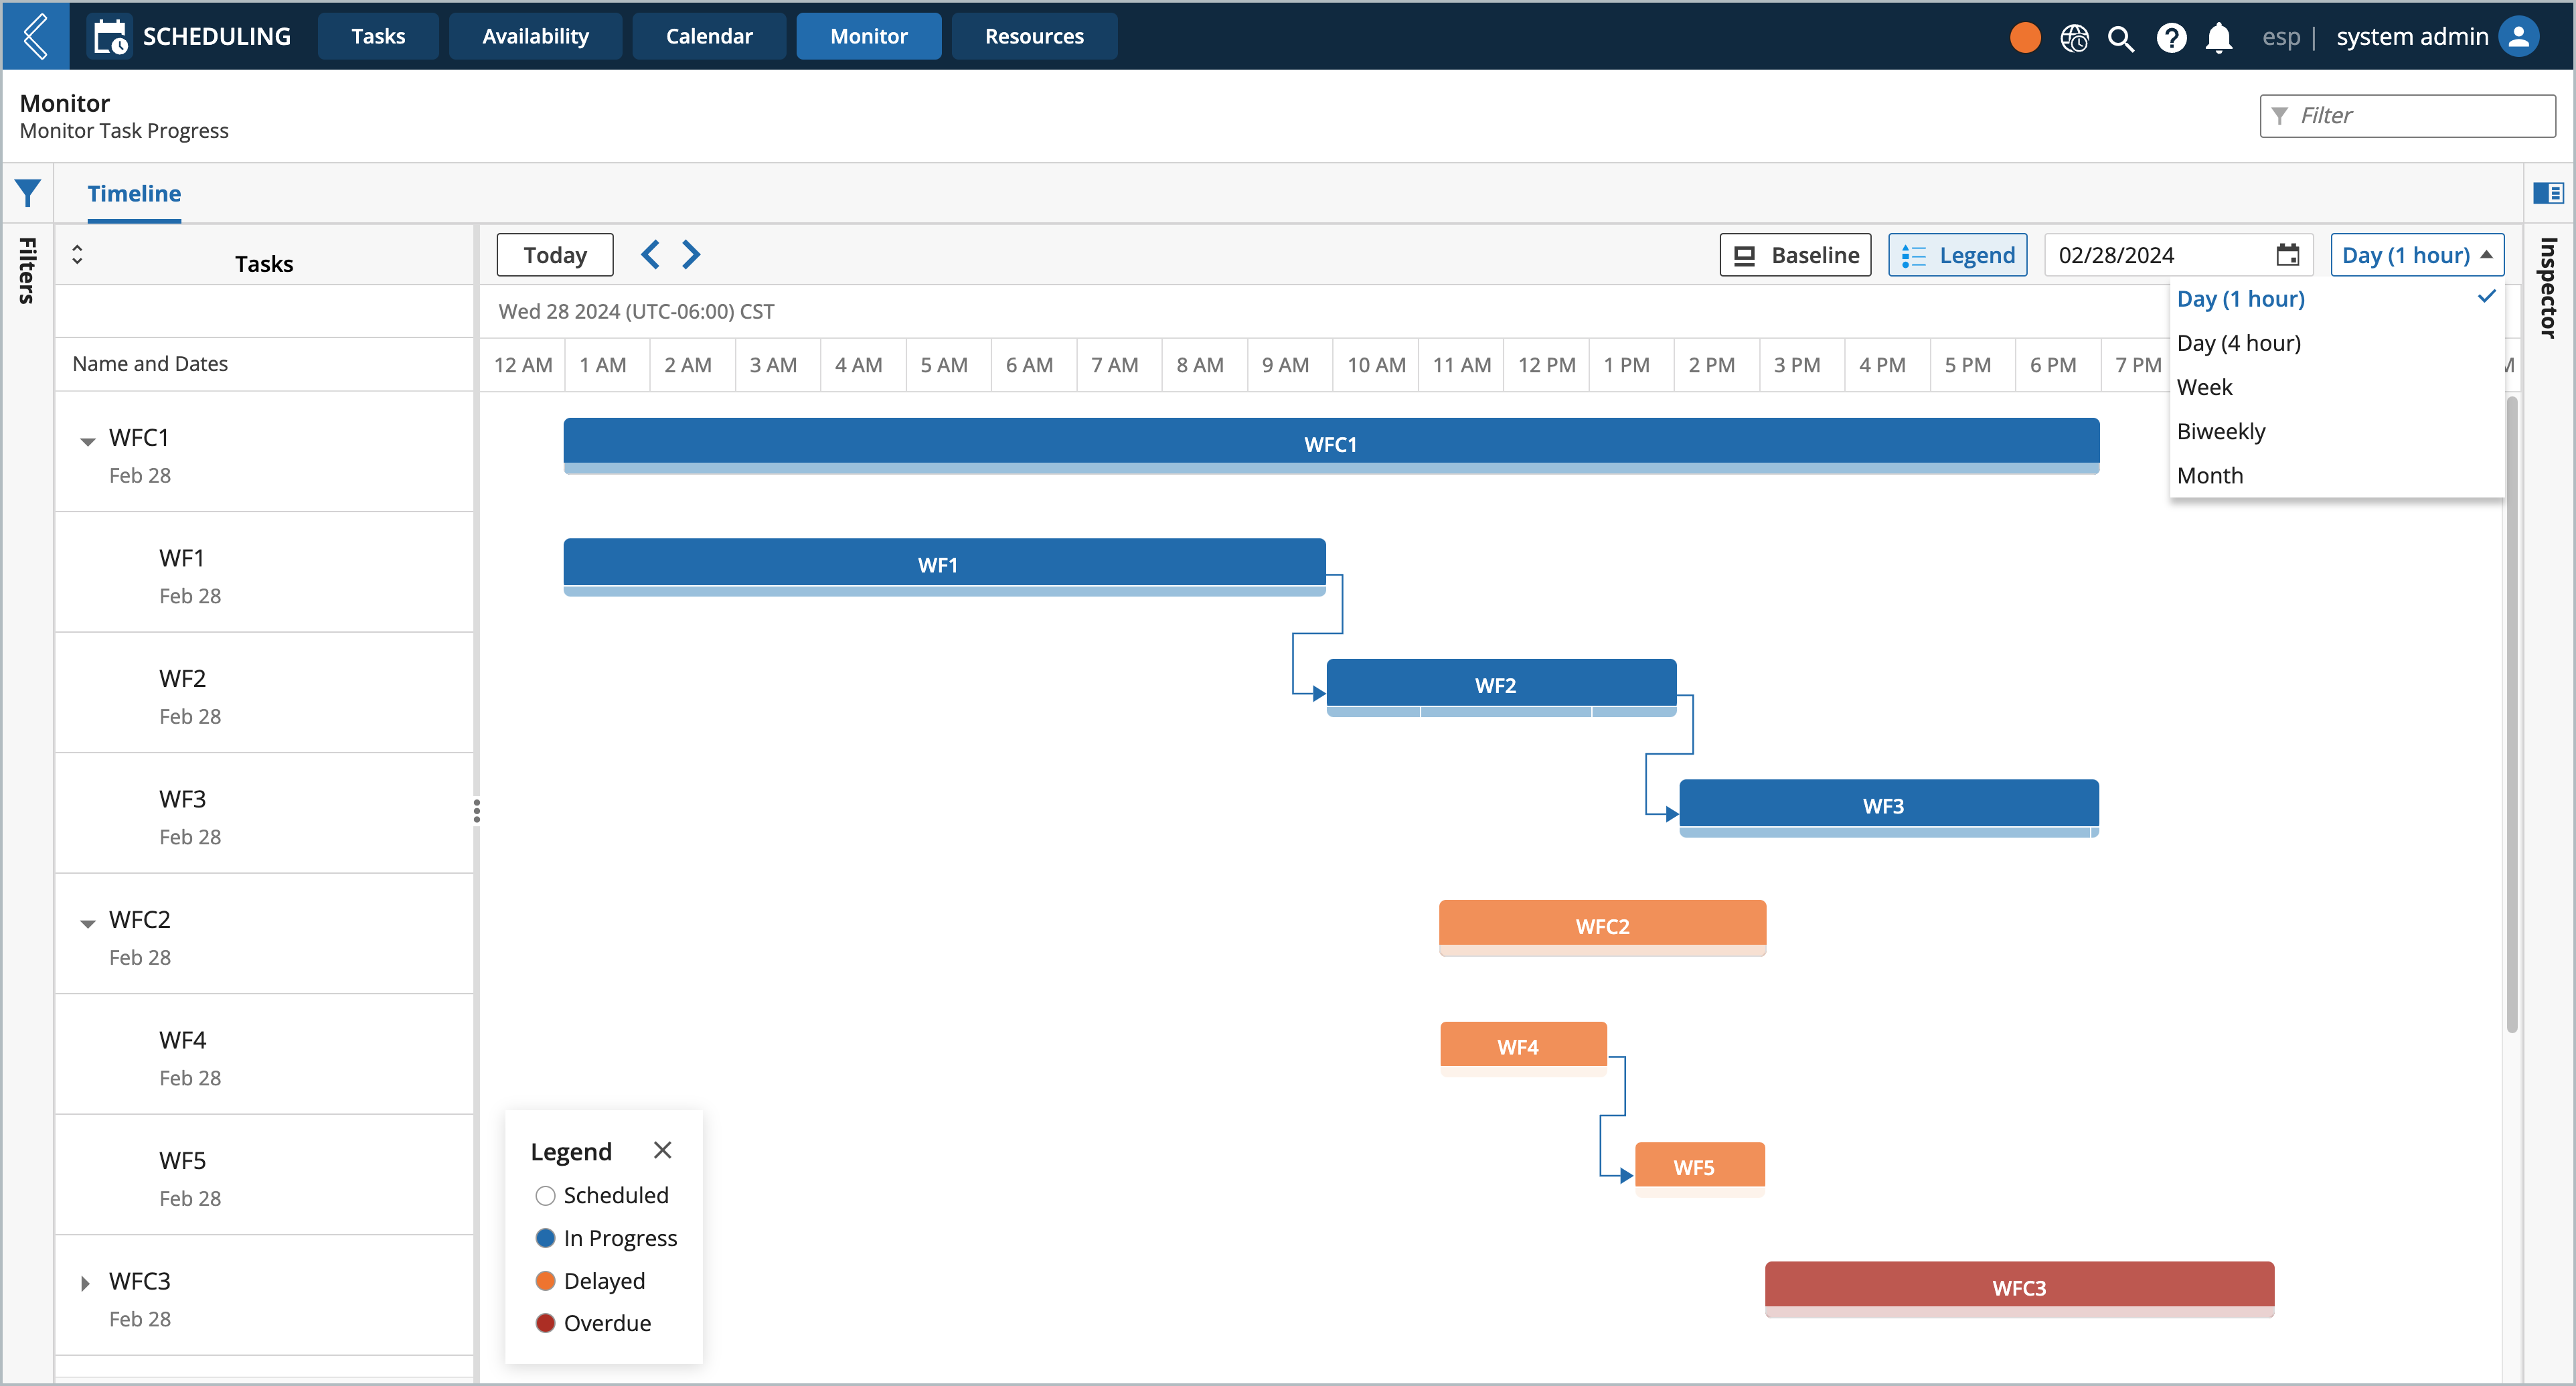
You can easy change the zoom of your calendar to view by day (1-hour time blocks), day (4-hour time blocks), week (default), biweekly, and month.
Navigating to Past and Future dates
Exploring the calendar is made easy using:
Navigation arrows to view past and future dates
Today button to return to today's calendar view
Selectable date range picker to quickly view specific date(s)
Viewing Real-Time Progress
From the Monitor page you can view the real-time progress of all your process-related tasks (Workflows and Workflow Chains).
Tracking Tasks
L7 Scheduling will automatically track and display task progress on the timeline at the level of the Workflow Chain, down to the Protocol.
You can use the Tasks panel on the left-hand side to view the task names, associated dates, and expand scheduled Workflow Chains to show the Workflows nested within them.
When viewing Workflows, you will see a task bar below each Workflow that reflects the number of Protocols that comprise them.
Inspecting Tasks
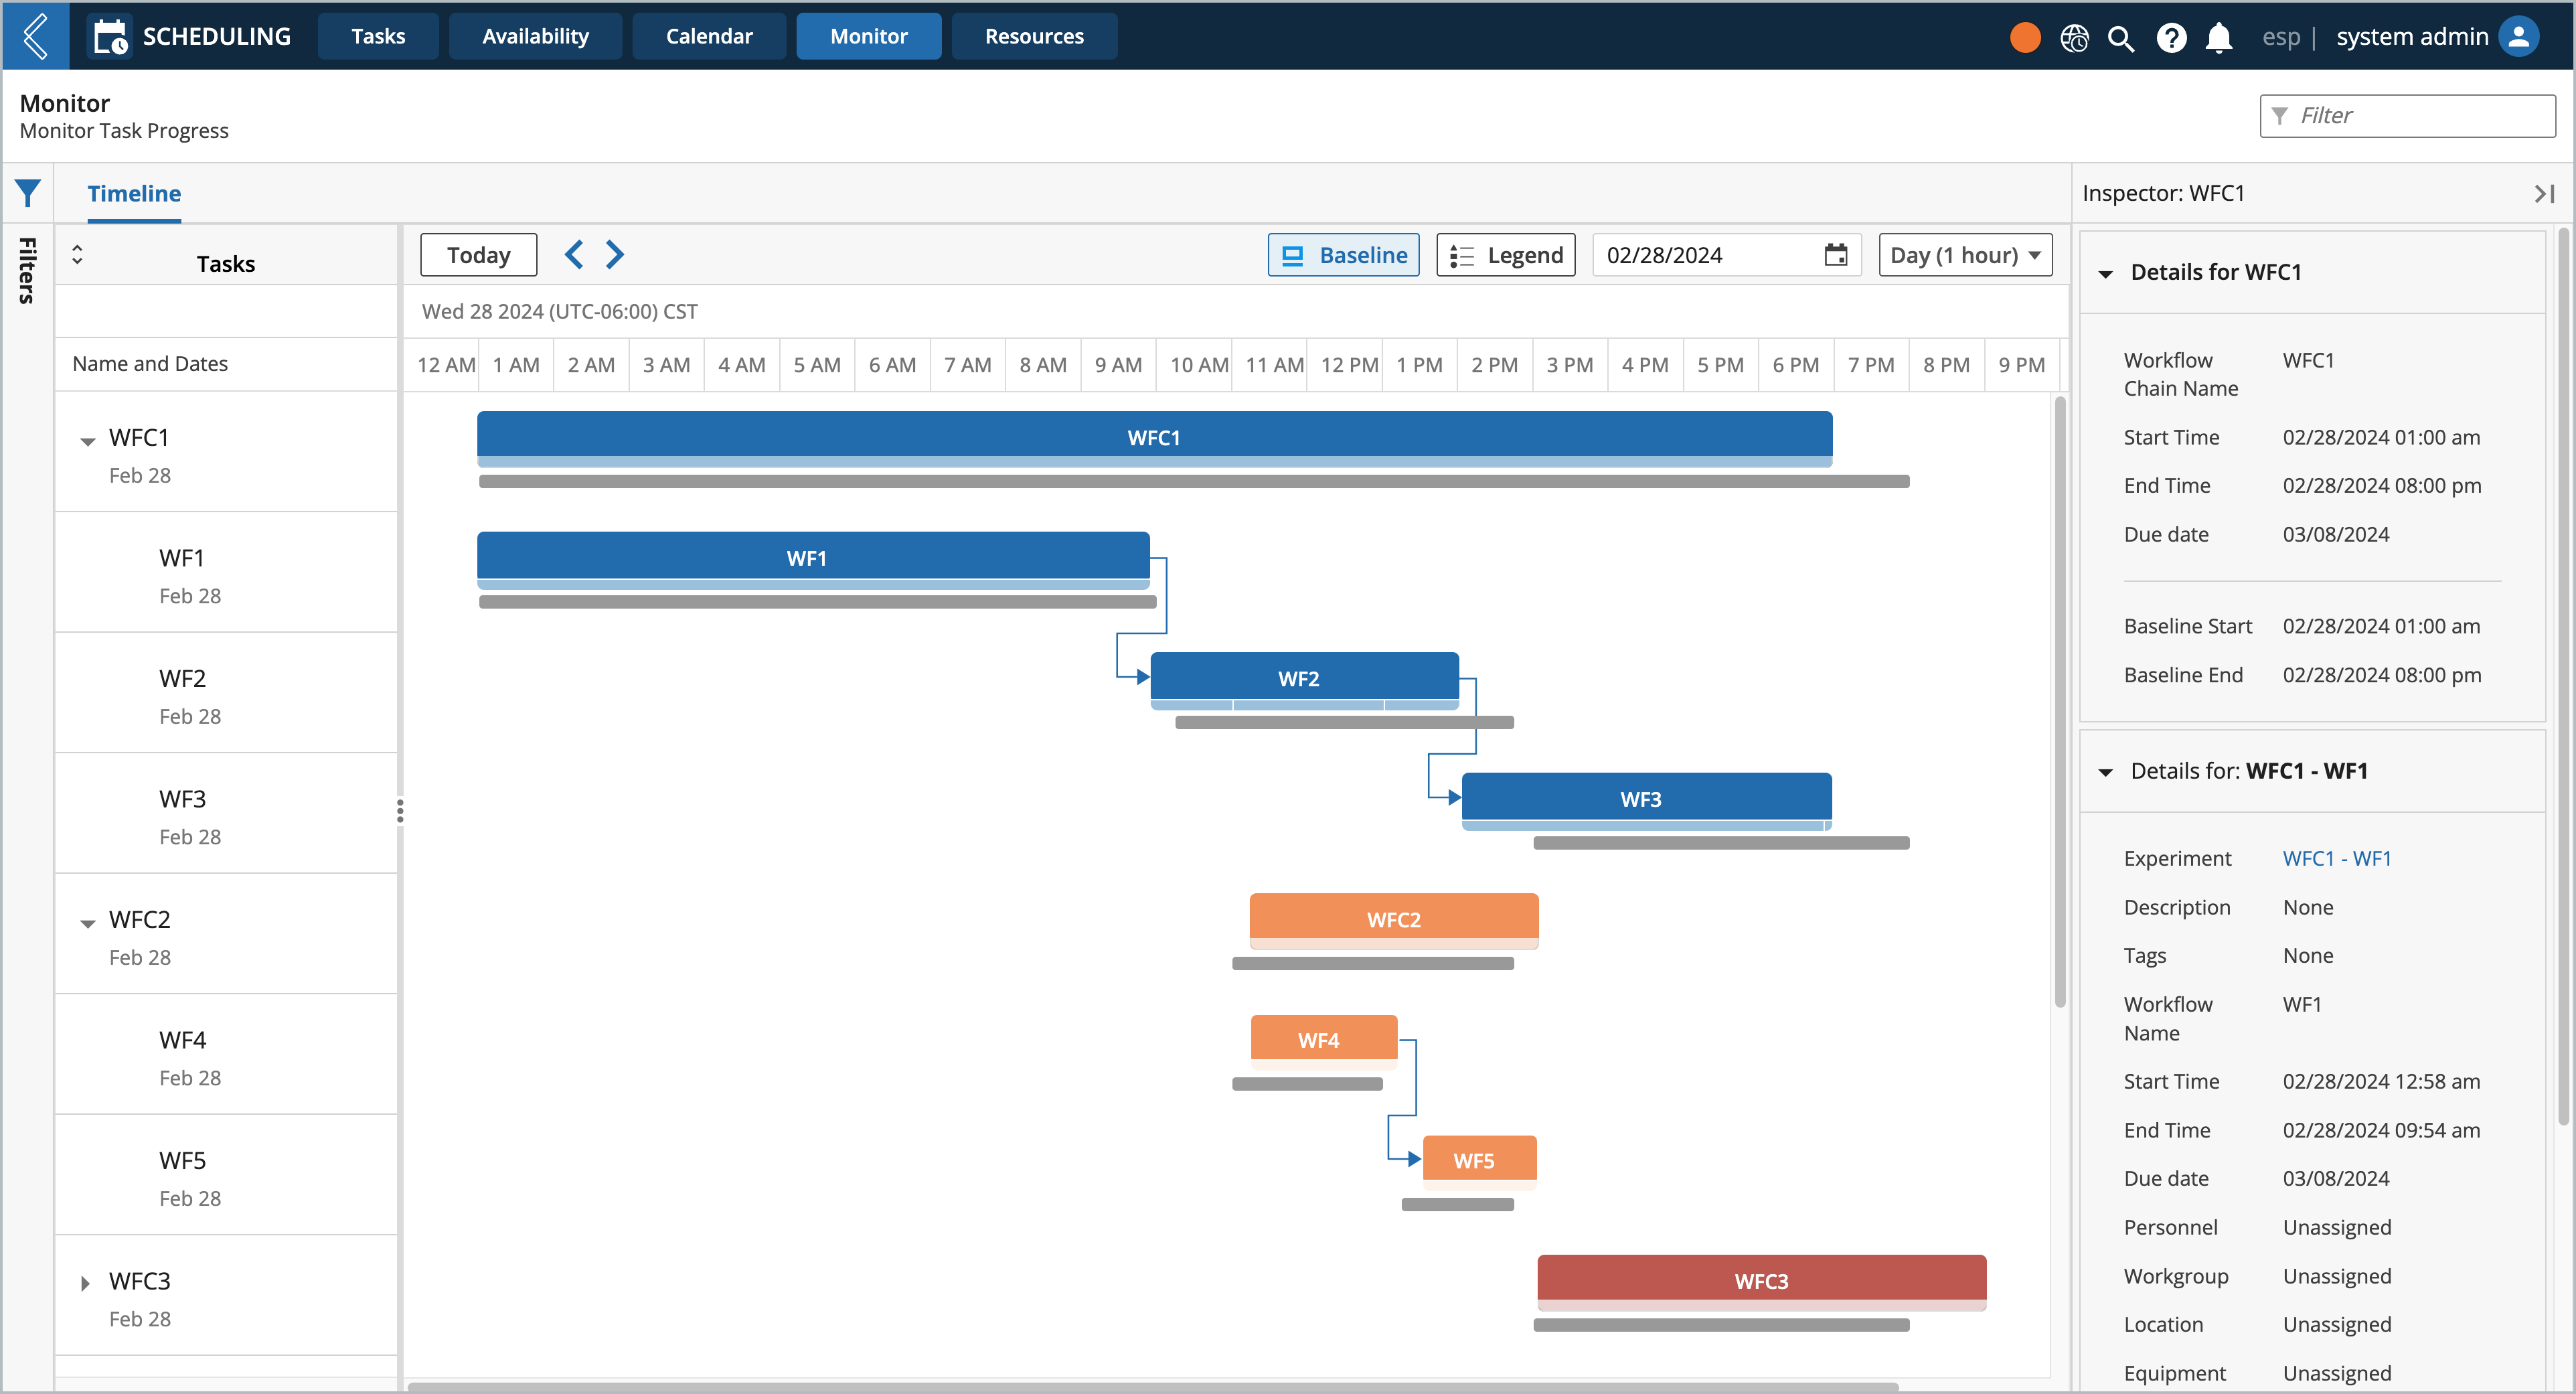
If you want to take a closer at a task, you can use the Inspector panel on the right-hand side. Simply select any task from the timeline to populate the panel and review the specific details for that task, including:
Start and end times
Due date
Baseline time
Experiment details (name, description, tags, workflow name)
Links to the Experiment's LIMS Worksheet
Assigned resources
Comparing Planned and Real-Time Progress
In addition to viewing your task's real-time progress, you can compare its progress to the expected baseline time and due dates.
The Baseline button can be selected to display a bottom taskbar, which acts as a reference toward the expected completion of the task.
The start time is defined when the task is scheduled in the Calendar tab, while the end time is calculated from the duration defined by each protocol, workflow, or workflow chain.
Filtering Tasks
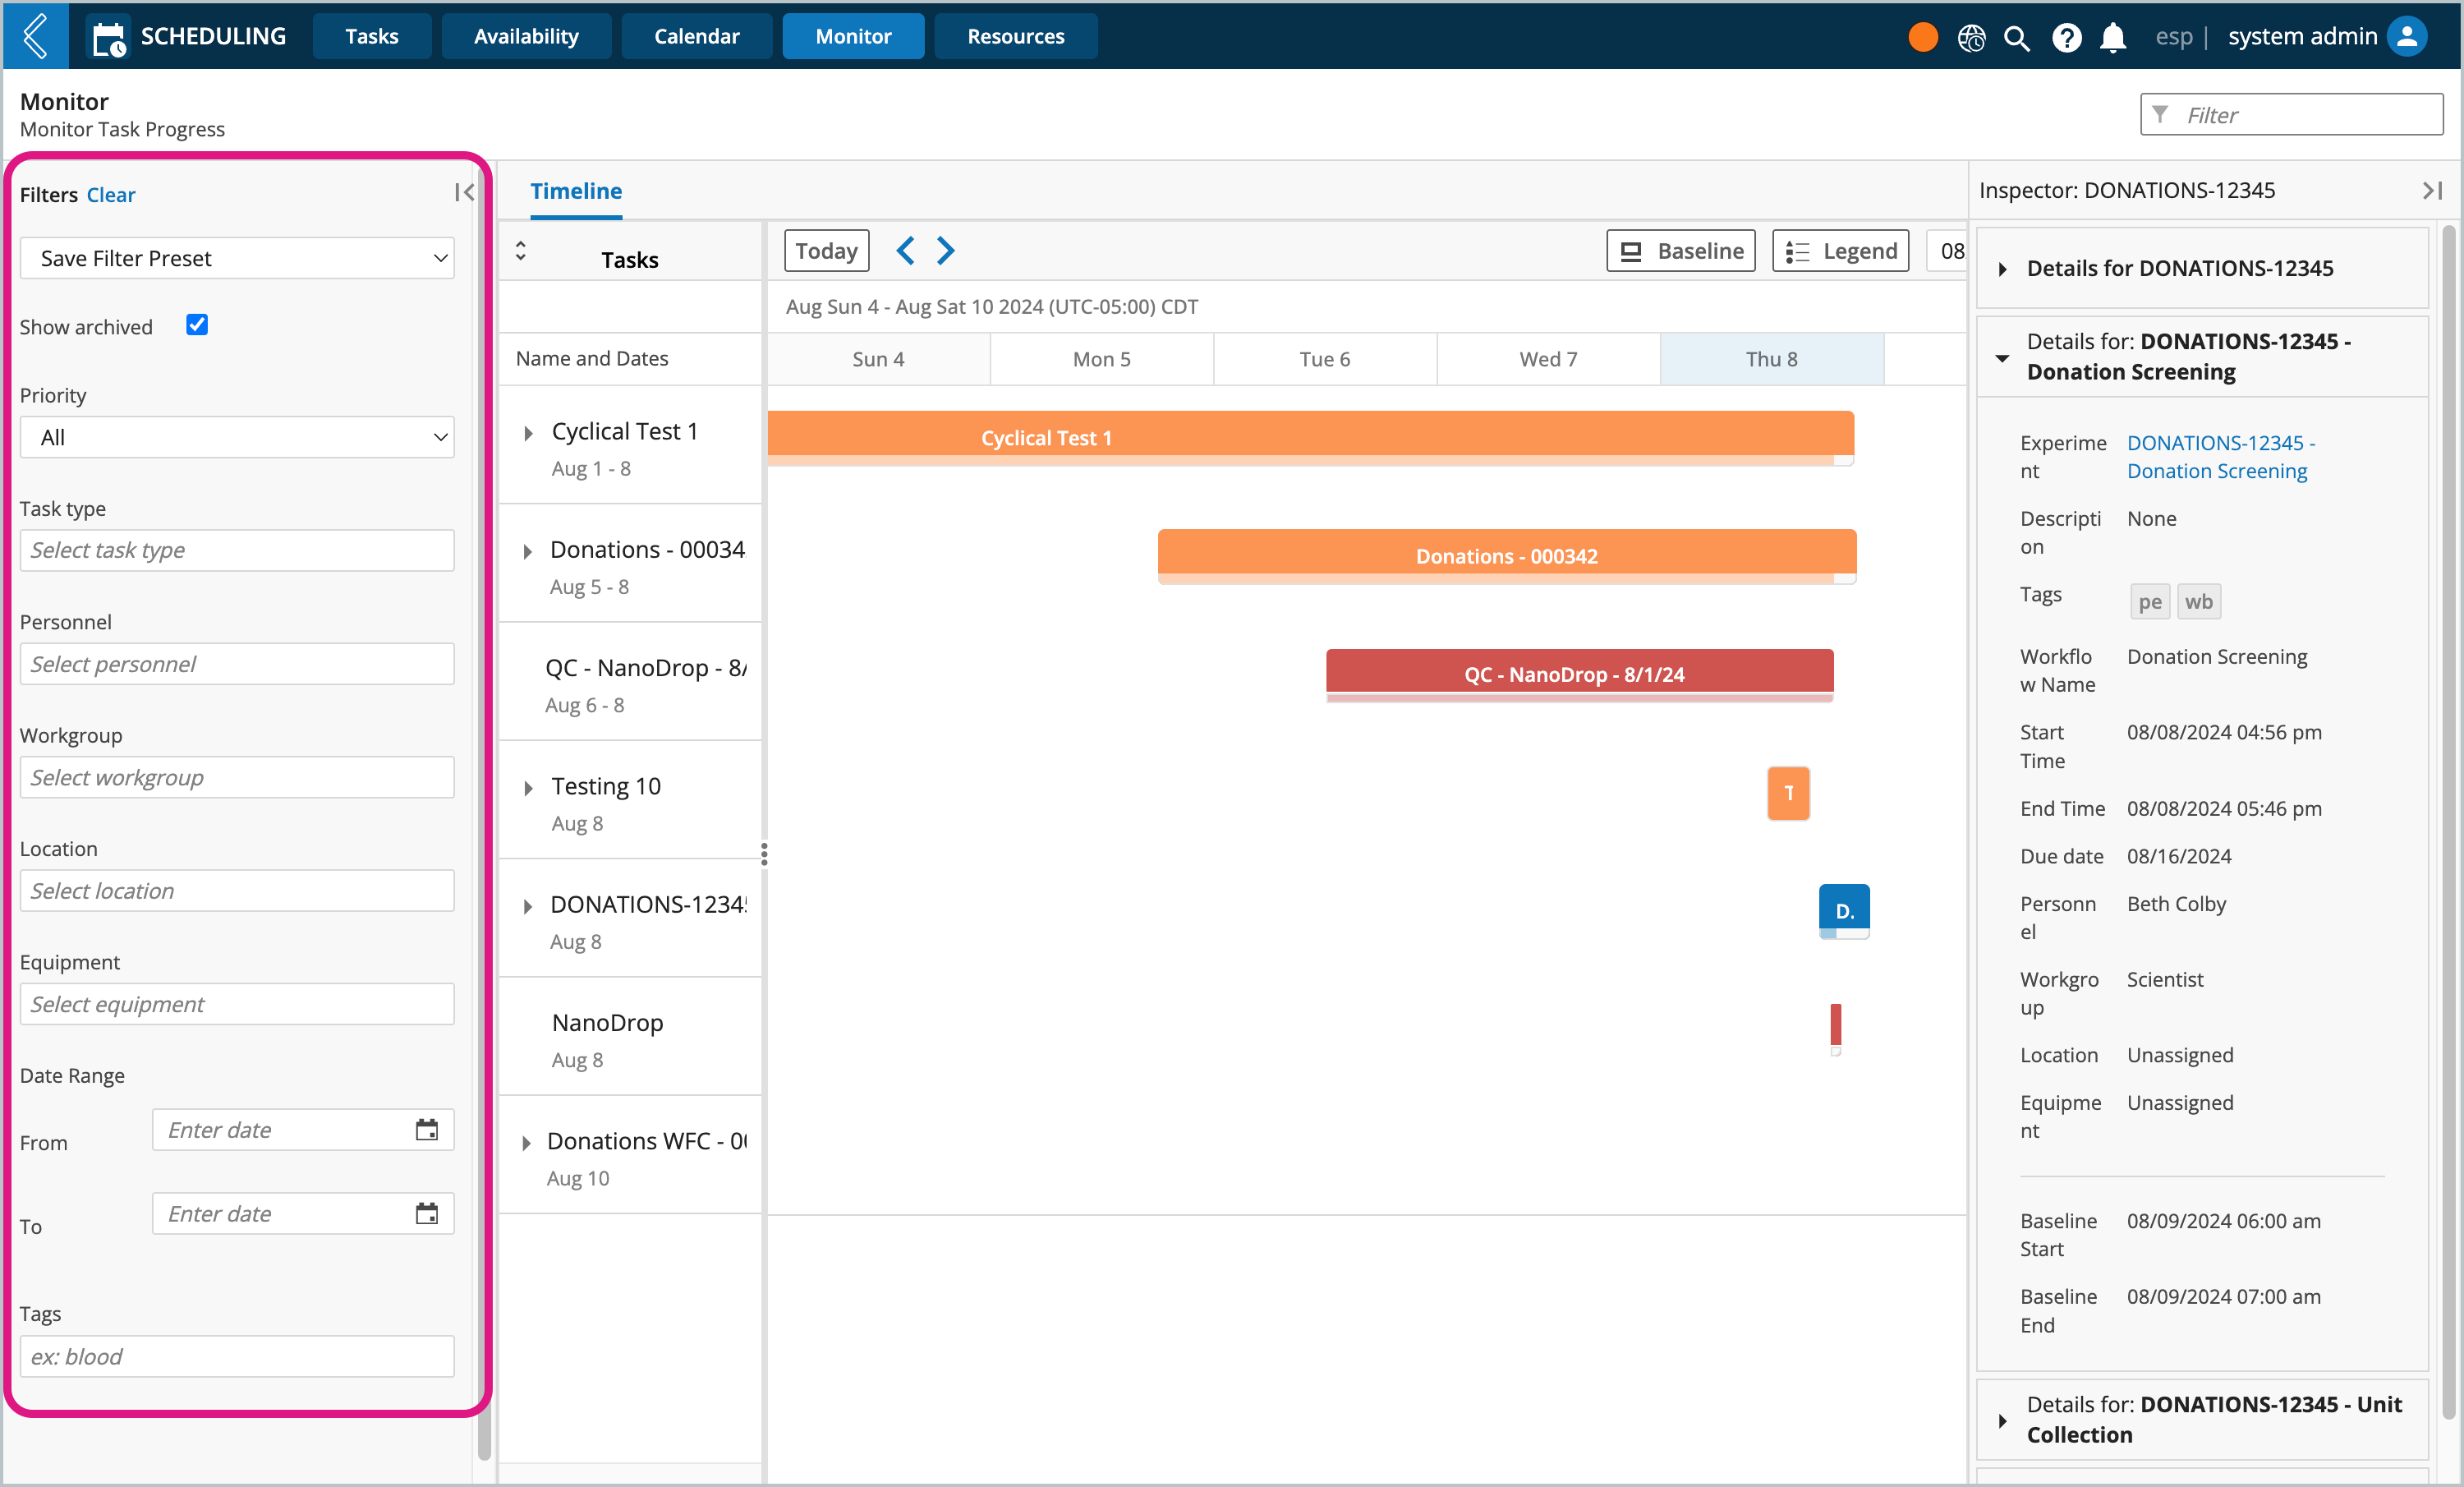
If you want to only see specific tasks on the timeline or view archived tasks, you can use the Filters panel on the left-hand side.
Tip
Create Filter Presets to save your commonly used filters.
