Debugging Server-side Extensions
Debugging Server-side Extensions
PDB
We can use the standard Python debugger to debug server-side extensions, as long as we attach to the correct running process. To use the debugger, do the following:
Place a breakpoint in the file you are interested in
import pdb
pdb.set_trace()
Ensure your changes are synced properly:
make serverextStop the web worker services:
l7 stop l7-esp.http:*Start a single web worker service:
l7 start l7-esp.http:l7-esp.http.0Put the webworker into the foreground:
/usr/bin/python /usr/local/bin/supervisorctl fg l7-esp.http:l7-esp.http.0Trigger your extension (e.g. transition samples, execute expression, etc.)
When you're finished debugging, you can re-sync your changes with the backend, then run l7 stop l7-esp.http:* and l7 start l7-esp.http:*
Visual Studio Code integrated debugger
During debugging it may be helpful to disable the queue service to force all operations to the attached webworker. This can be done in the Config app > feature_flags > set
"async_calls": {"status": "disabled"}> save and restart ESP services.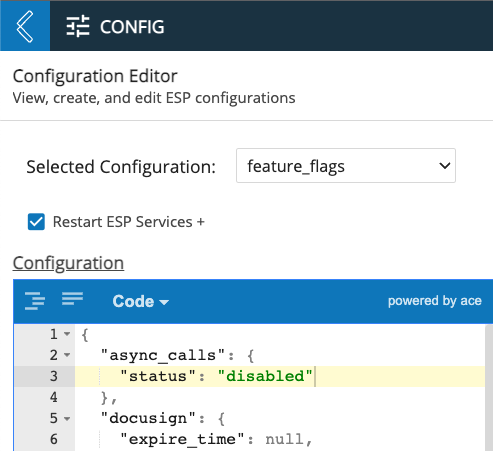
Add a folder named
.vscodeto the directory open in VS Code with the files with the following contentlaunch.json{ "version": "0.2.0", "configurations": [ { "name": "l7-esp.http", "type": "python", "request": "launch", "program": "/opt/l7esp/server/services/l7-esp.http.py", "console": "integratedTerminal", "justMyCode": false, "python": "/usr/bin/python", "args": [ "-n", "api" ], "preLaunchTask": "stop l7 webworkers", "postDebugTask": "start l7 webworkers" } ] }tasks.json{ "version": "2.0.0", "tasks": [ { "label": "stop l7 webworkers", "command": "l7 stop l7-esp.http:* || echo 0", "type": "shell", }, { "label": "start l7 webworkers", "command": "l7 start l7-esp.http:* || echo 0", "type": "shell", } ] }Open
/opt/l7esp/data/extensions/server/l7ext(in the toolbar select Go → Go to file → enter file path) where all of the server side extensions are located, open the file to debug, and set a breakpoint in the function to debug.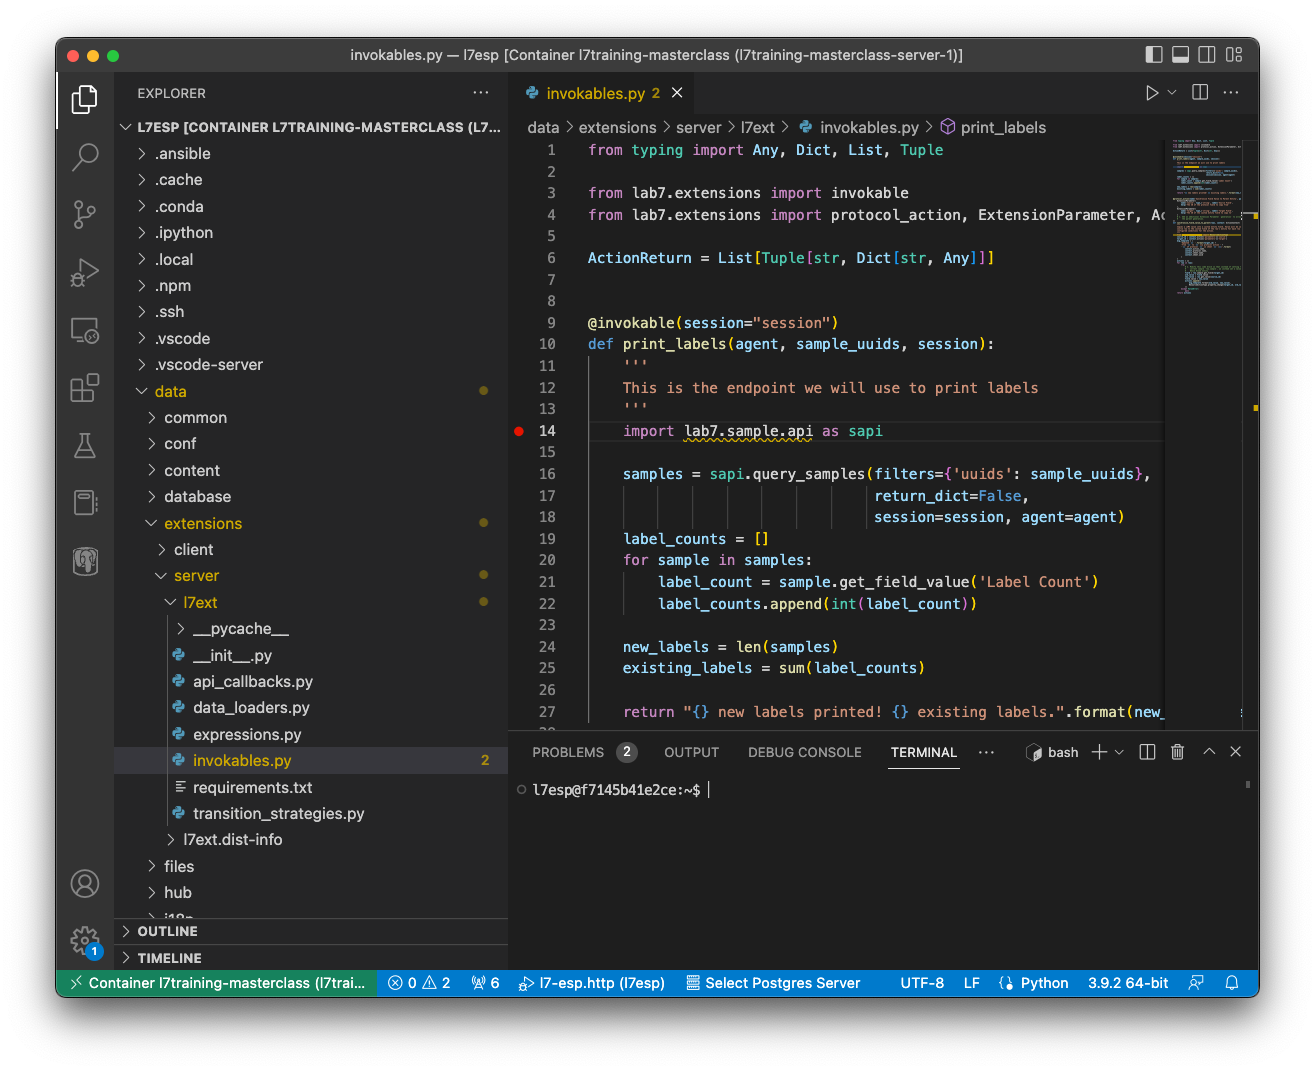
Open Run and Debug and click on the Run button to begin the debugger. This will stop all webworkers, start and attach to one webworker.
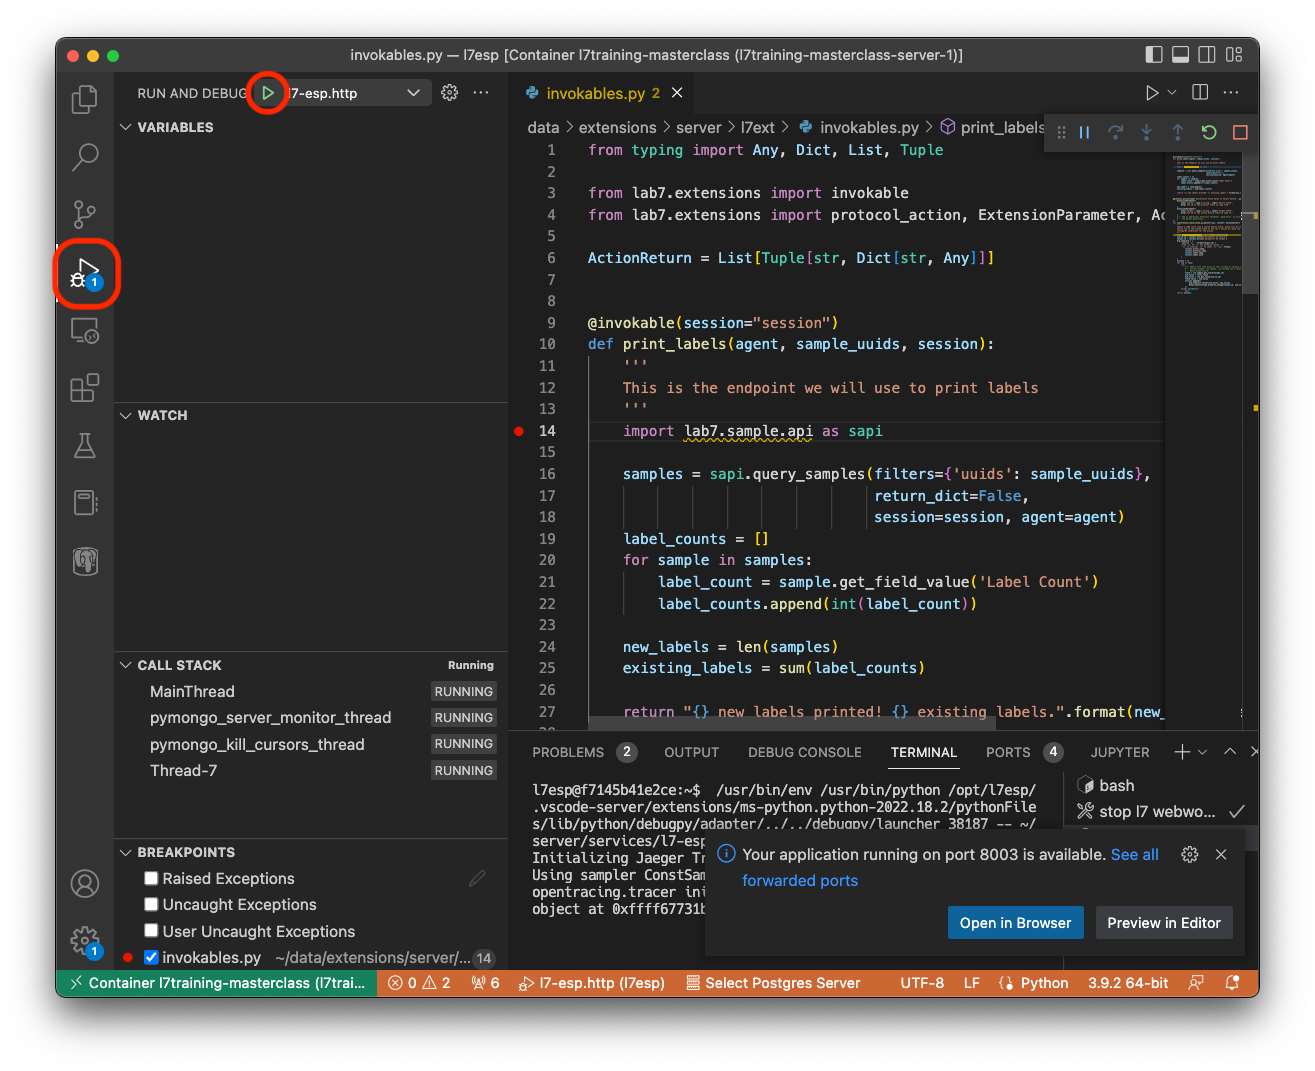
Use the integrated debugger to debug as in the above instructions. Add breakpoints, and monitor the progress of your code by going through the actions / invokables in the ESP instance running in your browser.
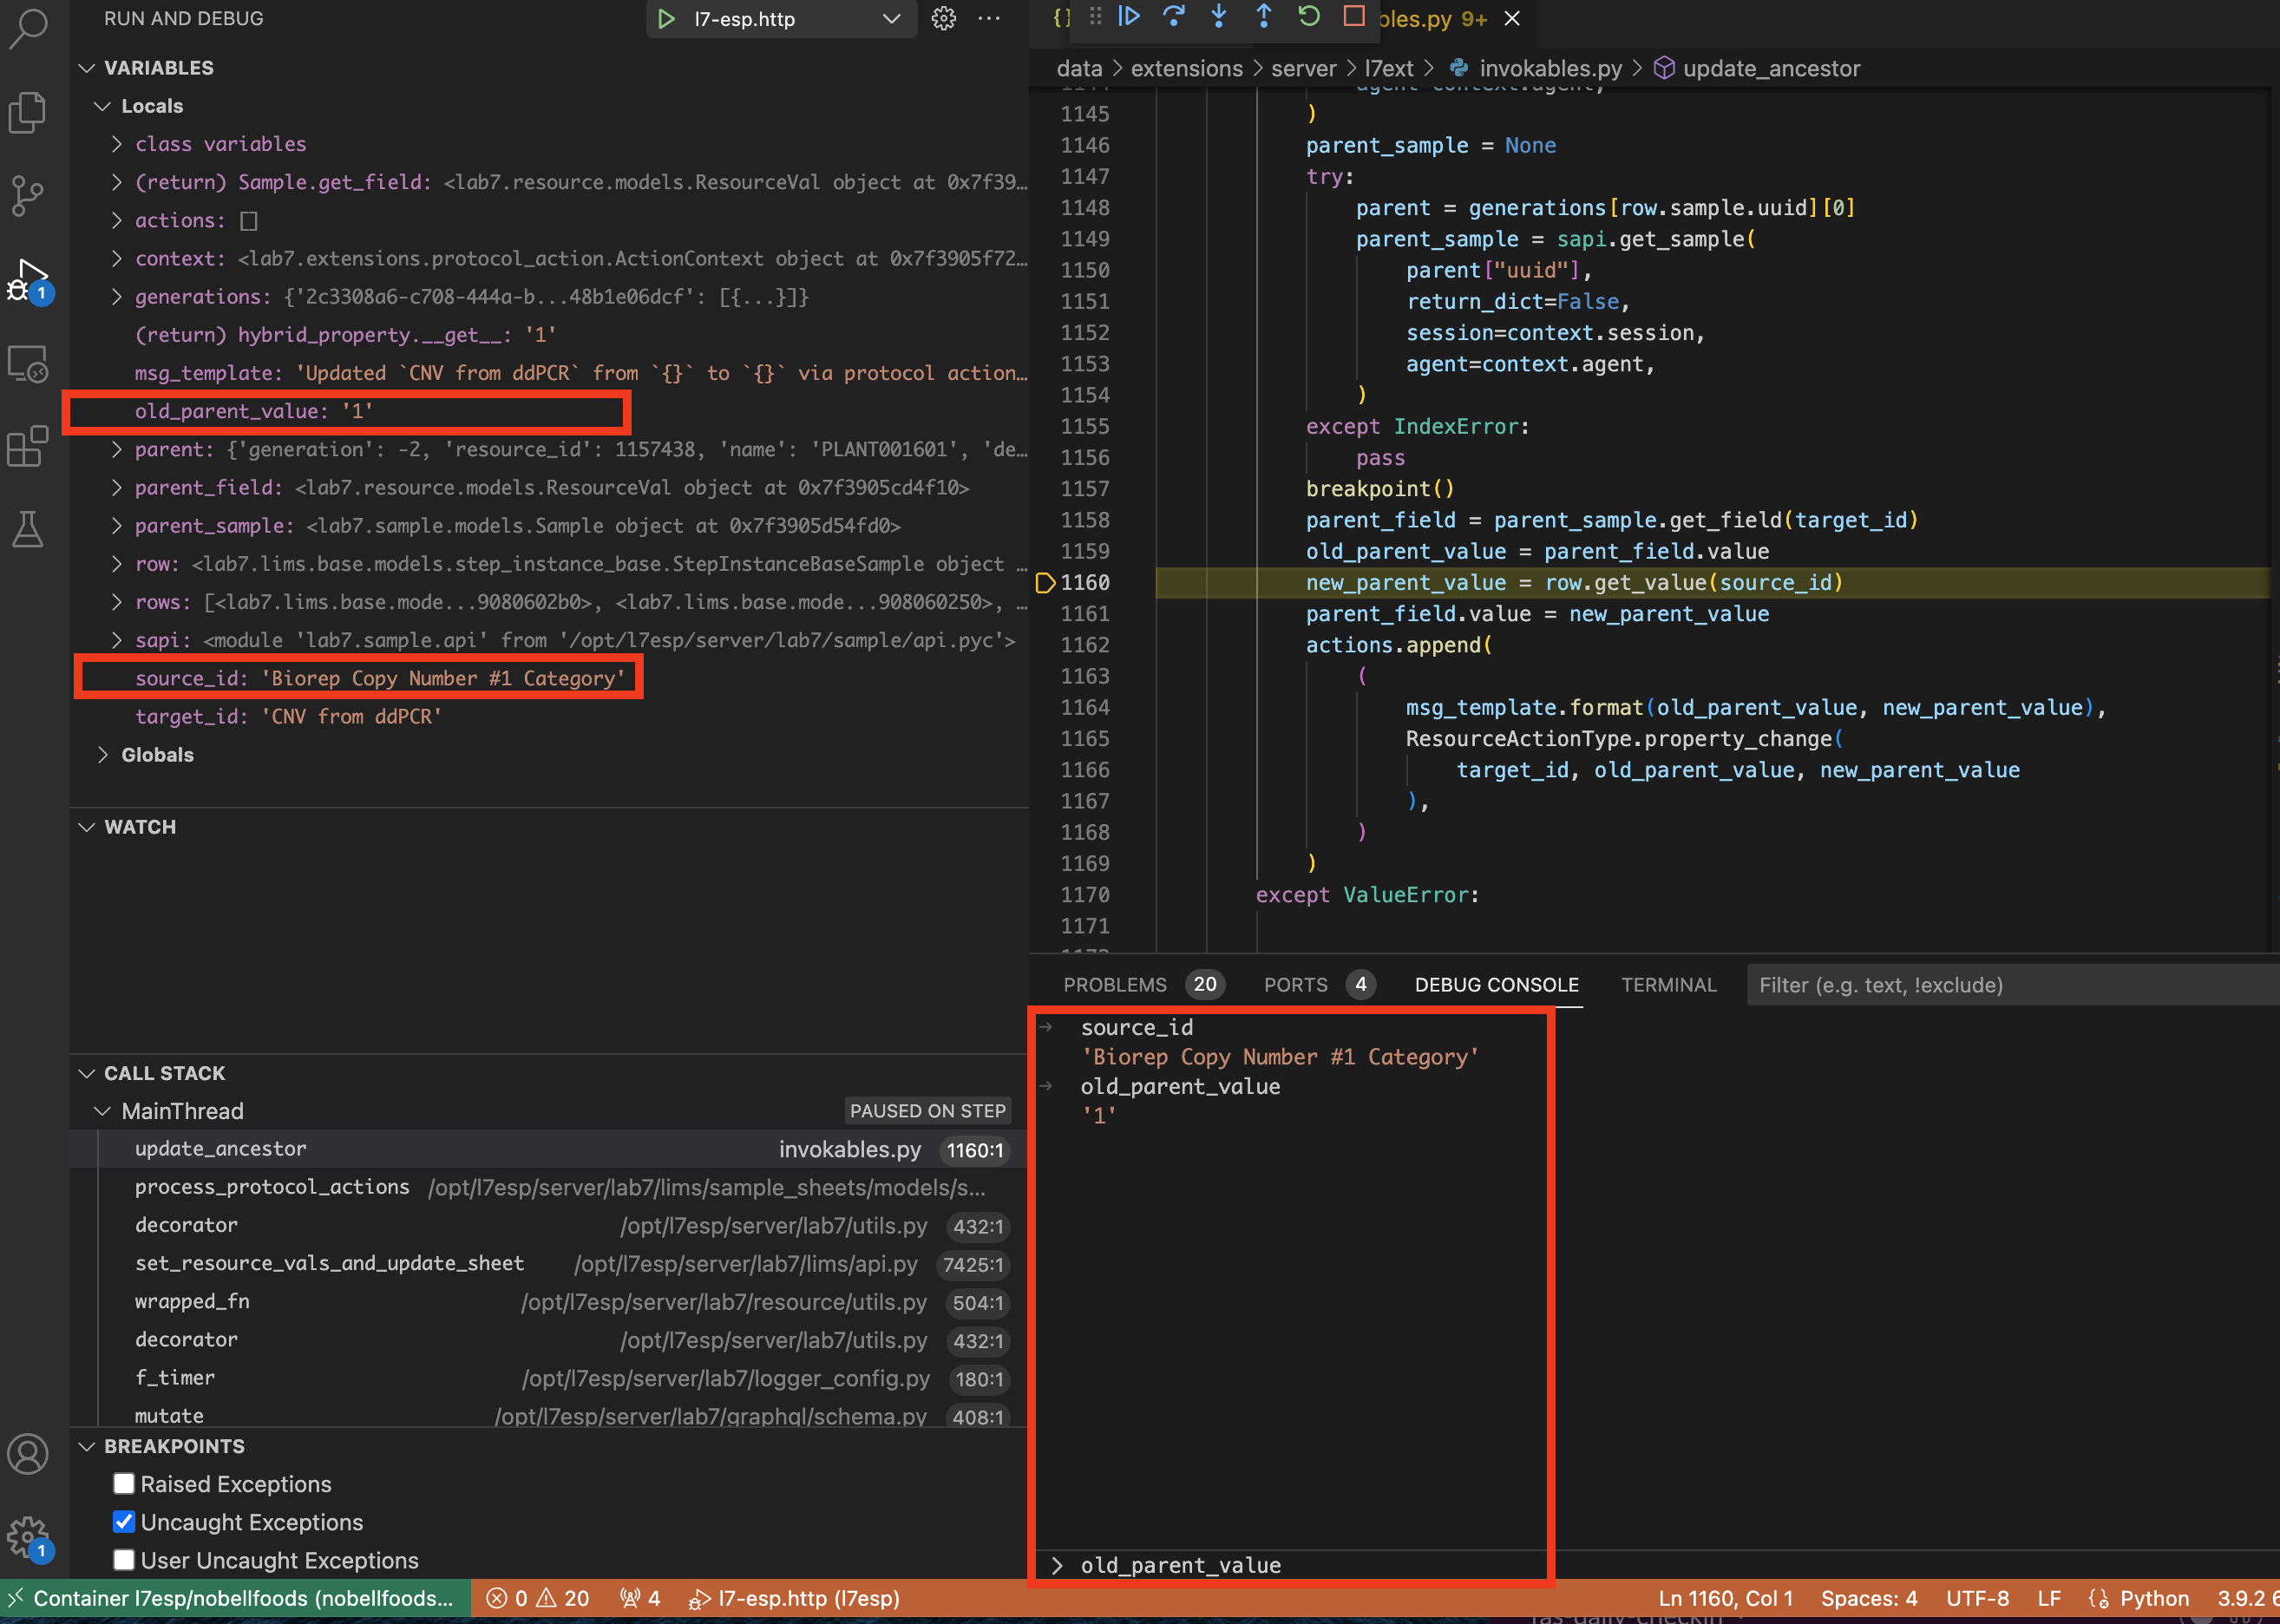
If part of your debugging involves monitoring variable values, these can be checked either in the panel on the left, or by using the debug console.
Note that any changes made here must be copied over to the code repo you were originally working with.
Stop the debugger when finished. This will then restart all of the webworkers. Close the debug and task terminals when finished.