Reference: How to Use and Search Logs in ESP
The default configuration for ESP will store logs inside the application container as files at the directory /opt/l7esp/data/log. Log files for each of the primary processes are stored here, and generally will require command line access to read and download. For ESP user interface access to logs, consider the Log Exporter bundle (contact L7 Support or Account Management for details on the bundle). Logs can also be shipped to an external log service with additional configuration.
Logs give details on overall system health, capturing diagnostic information about normal operations as well as any potential errors occurring within the server processes. Logs can be useful for identifying sources of failures, and identifying long running operations.
Log Folder Example
Logs are stored by service name. The log name format is approximately <deployment-name-or-container-id>-l7-esp.<process-name>.log.<log-number>. By default, logs will rotate over time based on log file size (51MB default). Older logs will have an increasing log-number at the end of the filename, with the most recent log having no log-number suffix. Logs will continue to rotate until there are 10 logs for the given service, at which time the oldest log will rotate out and be removed.
(base) l7esp@foundry_training:~/data/log$ ls -lashrt | head -n 50
   0 -rwxrwxrwx  1 l7esp l7esp    0 Jul 16  2024 foundry_training-l7-esp.redis.err
4.0K -rwxrwxrwx  1 l7esp l7esp  853 Jul 16  2024 foundry_training-l7-esp.incoming.err
8.0K -rwxrwxrwx  1 l7esp l7esp 6.0K Jul 16  2024 foundry_training-l7-esp.queue.err
4.0K -rwxrwxrwx  1 l7esp l7esp  854 Jul 16  2024 foundry_training-l7-esp.queue.log
4.0K -rwxrwxrwx  1 l7esp l7esp  578 Jul 17  2024 foundry_training-l7-esp.incoming.log
   0 -rwxrwxrwx  1 l7esp l7esp    0 Sep 16  2024 foundry_training-l7-esp.console.access.log
4.0K -rwxrwxrwx  1 l7esp l7esp  958 Dec  9  2024 38a890b1a1d1-db.log
 12K -rwxrwxrwx  1 l7esp l7esp 8.3K Dec 10  2024 b4678d282602-db.log
272K -rwxrwxrwx  1 l7esp l7esp 267K Dec 10  2024 b4678d282602-supervisord.log
240K -rwxrwxrwx  1 l7esp l7esp 234K Dec 12  2024 b4678d282602-l7-esp.http.api.2.access.log
236K -rwxrwxrwx  1 l7esp l7esp 230K Dec 12  2024 b4678d282602-l7-esp.http.api.1.access.log
240K -rwxrwxrwx  1 l7esp l7esp 234K Dec 12  2024 b4678d282602-l7-esp.http.api.0.access.log
4.2M -rwxrwxrwx  1 l7esp l7esp 4.2M Dec 12  2024 b4678d282602-l7-esp.log
4.0K -rw-r--r--  1 l7esp l7esp 3.1K Dec 18  2024 foundry_training-l7-esp.loki.log
 51M -rwxrwxrwx  1 l7esp l7esp  51M Dec 19  2024 foundry_training-l7-esp.http.log.3
 51M -rwxrwxrwx  1 l7esp l7esp  51M Dec 19  2024 foundry_training-l7-esp.pipeline.log.1
2.8M -rw-r--r--  1 l7esp l7esp 2.7M Dec 19  2024 foundry_training-l7-esp.http.log.2
 16M -rw-r--r--  1 l7esp l7esp  16M Dec 19  2024 foundry_training-l7-esp.http.log.1
The .log suffix files will detail normal operations (and can include errors successfully caught and handled by the system). The .err suffix files generally capture errors during process startup and can be a good place to search for problems if any of the supporting processes fail to start.
Which log should I look at?
The most immediately useful logs are often the http logs and the .err logs for a given service if it fails to stay running.
For general web traffic and how long each API call takes: l7-esp.http.#.access log files
Each webworker will have its own files, by default ESP has 3 webworkers
l7-esp.http.0 , l7-esp.http.1, …
After the log file hits a certain size (~51MB), a new file is created
l7-esp.http.0.log, l7-esp.http.0.log.1, l7-esp.http.0.log.2, …
For detailed web traffic: l7-esp.http.#.log files
Includes request body and tracebacks, including invokable extensions in the .log files
For timestamps covering the starting/stopping of services: supervisord.log
For services that fail to start or stay running (
l7 statusat the command line to see service status): Check the matching.errfile
How to look through the logs?
Some familiarity with the command line will be needed to analyze the log files. The commands shared here are for a bash/Debian-like OS environment, which is the same operating system environment for the ESP application. Utilities like tail, more, grep are already packaged in the ESP application container. Some utilities may not be available by default without additional installation like less, awk, sed.
Tailing the logs while triggering trouble spots in the application (using a browser or other developer tool) can sometimes help in finding the most relevant logs.
Using the linux tail utility:
tail -f /opt/l7esp/data/log/* # follow the logs as new lines are written (all files using the * wildcard)tail -n 10 /opt/l7esp/data/log/l7-esp.http.0.access.log # look at the last 10 lines of the 0 worker access logFor issues that happened in the past, you could scroll through each log with a pager like the more utility:
more /opt/l7esp/data/log/l7-esp.http.0.access.logA better approach often will be to search the logs with utilities like grep, awk, sed to find a known issue.
Examples of Useful Log Searches
Search the access logs for API calls that take 10000.00 ms or longer:
grep -Er '([[:digit:]]{5,}).[[:digit:]]{2}ms' *l7-esp.http.api.[0-9].access*
To add additional filters, such as for a specific date (eg. 2024-05-13) simply pipe in an additional grep
grep -Er '([[:digit:]]{5,}).[[:digit:]]{2}ms' *l7-esp.http.api.[0-9].access* | grep '2024-05-13'Search all access logs for timestamps on December 12th 2021 between 5:20-5:40 PM UTC time, use sed to replace a delimiter so you can more easily sort all logs by time (rather than http 0, 1, 2 worker logs being ordered separately):
grep -Er '2021-12-21 17:[234]{1}' l7-esp.http.[0-9].access* | sed -E s/log[.]?[0-9]*:/^/g | sort --field-separator=^ --key=2Improved access log sort that that ensures access log times are also sorted in addition to date:
grep -Er '([[:digit:]]{2,}).[[:digit:]]{2}ms' l7-esp.http.[0-9].access* | grep -Erh '04-07 1[78]' | sed -E s/log:/log:^/g | sed 's/([0-9][0-9][0-9][0-9])-([0-9][0-9])-([0-9][0-9]) /\1\2\3^/g' | sort --field-separator=^ --key=2,3Note the grep filters on minimum time (>10 ms) here, as well as a specific date (April 7th) and time range (1700-1800 hours UTC). We insert the ^ character to help denote the date & time pieces of the log lines
Search detailed request logs to match a particular timestamp (format differs from access logs):
grep -Er '2021-12-21T17:30:11' l7-esp.http.log* Search detailed request logs to match an invokable endpoint:
grep -Er '/api/invoke/my_endpoint' l7-esp.http.log* Use jq Linux utility (may need to install with apt install ) to extract specific keys from the JSON-style http.log:
grep -Erh '2022-04-07T1[78]:..:..' l7-esp.http.log* | jq -r '[.timestamp,.func_name,.execution_ms] | join(" | ")' | less Search supervisord log for non-zero exit status for http webworkers:
grep 'l7-esp.http*.*exit status [1-9]' supervisord.log | sed -E 's/log[.]?[0-9]*:/^/g' | sort --field-separator=^ --key=2 | less Above searches can be piped into less, or redirected to a file for easier viewing.
grep ... | sed ... | sort ... | less grep ... | sed ... | sort ... > log_search.txt Tar/Zip All Log Files
It can be useful zip up all of their logs, so that they can shared.
To create log tar file for all logs:
Collect all of the logs for the past 30 days and compress them into a tar file:
find /opt/l7esp/data/log -mtime -30 -type f -print0 | tar --create --file "${PWD}/logs.tar" -z --null --files-from=-; # Change -mtime to adjust number of days to collectModifying how logs are generated and stored
The ESP process supervisor, supervisord, controls how logs are named and stored. Settings for each service are in the supervisord.conf configuration file at /opt/l7esp/data/conf/supervisord.conf in the filesystem.
Example:
[program:l7-esp.http]
command=python %(ENV_LAB7DIST)s/services/l7-esp.http.py -s %(process_num)s -n api
process_name=%(program_name)s.%(process_num)s ; process_name expr (default %(program_name)s)
numprocs=%(ENV_L7ESP_HTTP_NUMPROCS)s      ; number of processes copies to start (def 1)
; .... clipped out non-logging settings here ;
;redirect_stderr=true          ; redirect proc stderr to stdout (default false)
stdout_logfile=%(ENV_LAB7LOGDIR)s/%(ENV_HOSTNAME)s-%(program_name)s.log        ; stdout log path, NONE for none; default AUTO
;stdout_logfile_maxbytes=1MB   ; max # logfile bytes b4 rotation (default 50MB)
;stdout_logfile_backups=10     ; # of stdout logfile backups (0 means none, default 10)
;stdout_capture_maxbytes=1MB   ; number of bytes in 'capturemode' (default 0)
;stdout_events_enabled=false   ; emit events on stdout writes (default false)
;stdout_syslog=false           ; send stdout to syslog with process name (default false)
stderr_logfile=%(ENV_LAB7LOGDIR)s/%(ENV_HOSTNAME)s-%(program_name)s.err        ; stderr log path, NONE for none; default AUTO
;stderr_logfile_maxbytes=1MB   ; max # logfile bytes b4 rotation (default 50MB)
;stderr_logfile_backups=10     ; # of stderr logfile backups (0 means none, default 10)
;stderr_capture_maxbytes=1MB   ; number of bytes in 'capturemode' (default 0)
;stderr_events_enabled=false   ; emit events on stderr writes (default false)
;stderr_syslog=false           ; send stderr to syslog with process name (default false)
Settings leading with ; are commented out, but will use the supervisord provided defaults. % symbols represent variables and are surrounded with round parenthesis and a variable type code like %(ENV_MY_VARIABLE)s - which will get the MY_VARIABLE from the environment and coerce it to a string type.
Explanations for the most common settings are below:
stdout_logfile=%(ENV_LAB7LOGDIR)s/%(ENV_HOSTNAME)s-%(program_name)s.log
LAB7LOGDIR by default is /opt/l7esp/data/log
HOSTNAME is set by Docker in this case, and will usually be the randomly generated application container ID
For single instance deployments such as Docker Compose, the hostname variable can be set in docker-compose.yml like: services: server: hostname: my_esp_project
Setting the hostname in these deployments can be useful, as the logs name will be static and the log rotation will be more effective in minimizing log folder size (container id will generally rotate on container restart)
stdout_logfile_maxbytes - the maximum size for a single logfile, 50MB default per file when not specified
stdout_logfile_backups - the maximum number of older log files, before the oldest log will begin to rotate out
Similar settings apply for the stderr (
.err) files
When running ESP in a Cloud Service, you may want to redirect the logs to the container's stdout/stderr. Supervisord is the primary container process (PID 1) for the container, and all of its child process logs (ESP services) will log out to the container's stdout/stderr. To skip file-based logging and send the logs to container stdout, the following adjustments can be made per-service:
[program:your_program_name]
command=/path/to/your/command
stdout_logfile=/dev/stdout
stdout_logfile_maxbytes=0
stderr_logfile=/dev/stderr
stderr_logfile_maxbytes=0
; Optional: this redirects stderr to stdout, combining the streams
redirect_stderr=true
For more detailed configuration of supervisord, please reference it's software documentation: https://supervisord.org/configuration.html
Log Levels
Similar to many applications, ESP has standard settings for log levels, allowing the ability to increase or decrease the logging verbosity. The logging levels follow Python's standard logging terminology:
https://docs.python.org/3/library/logging.html#logging-levels
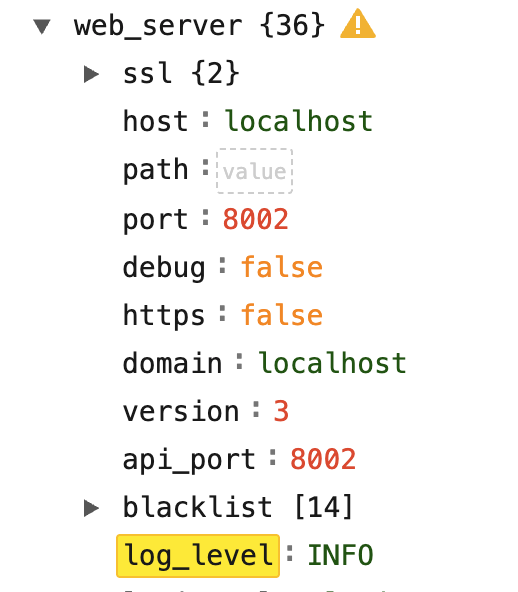
The most verbose log level is DEBUG, and the least verbose log level is CRITICAL. Generally, INFO level is sufficiently verbose for most operations.
The log level settings can be found in the system Configuration in the user interface of ESP:
 |
Redacting information from logs
Some logs may contain sensitive information located in the body of calls or from custom logging. To quickly remove sensitive information to allow logs to be transferred, a jq (which is like sed for json data) command can be used.
If jq is not already installed, it can be installed by sudo apt-get install jq
The from the log directory, the following command will only return non-sensitive information from all of the l7-esp.log files into one l7-esp-clean.log file which can then be transferred.
cat l7-esp.log* | jq -cR 'fromjson?' | jq -cs 'sort_by(.timestamp) | .[] | {request_id, session_id, pid, execution_ms, event, level, logger, timestamp, request_summary, status, traceback, value}' > l7-esp-clean.logcat l7-esp.log*specifies which files we want to process. Logs can be preprocessed withgrepbut make sure to use the-h, --no-filenameflag to suppress the prefixing of filenames on output when multiple files are searched (grep -h <what to grep for> l7-esp.log*)jq -cR 'fromjson?'reads the input as raw, strips out potential non-json data from the log, and returns compact json (the way logs look by default)jq -cs ''reads the input as a json array and will return compact jsonsort_by(.timestamp)sorts all log entries by timestamp.[]transforms it back from an array so entries appear as they do in logs by default{request_id, session_id, pid, execution_ms, event, level, logger, timestamp, request_summary, status, traceback, value}only keeps default keys which will should not contain any sensitive data (keys likebodyare stripped off)> l7-esp-clean.logdumps the result into a new file
More information on customizing the jq command can be found at:
jq docmuentation: jq 1.8 Manual
jq playground for testing: jq playground
Creating New ESP Logs in Extensions
Developers can generate their own custom log messages within their server side extensions of ESP like expressions, invokables, protocol actions, etc.
To use the default logger for the service where your code executes, use the following pattern:
# ./extensions/server/invokables.py
from lab7.extensions import invokable

import structlog
import traceback
logger = structlog.getLogger()

def custom_fn_with_intermittent_errors():
    raise Exception("Network down!")

@invokable(session="session")
def demonstrate_logging(agent, session, **kwargs):
    logger.info(f"Custom logging from my custom invokable API endpoint with variables: {kwargs}")
    try:
        custom_fn_with_intermittent_errors()
    except Exception:
        logger.error("Custom FN failed due to network outage!", extra={"traceback": traceback.format_exc()})
Developers can also create a dedicated log file, when needed. This can be useful to monitor the performance and stability of integrations with external systems which can experience their own transient problems such a network outages or new deployments.
# ./extensions/server/invokables.py
from lab7.extensions import invokable
from lab7.logger_config import build_handler

import structlog
import requests

other_service_logger = structlog.getLogger('other-service')

# The build_handler function sets up a RotatingFileHandler with an L7 defined log format
# You could write your own handler setup code if a different format is needed
other_service_logger.addHandler(build_handler(name='other-service', template='{hostname}-{name}.log'))
other_service_logger.setLevel('INFO')
other_service_logger.propagate = False

def integration_with_other_service(method, url, timeout=30, **kwargs):
    # Don't forget to set a timeout whenever you use requests or email package!
    # Recommend adding retry logic in case of intermittent connection issues as well.
    start_time = time.time()

    try:
        response = requests.request(method, url, timeout=timeout, **kwargs)
        duration = time.time() - start_time

        other_service_logger.info(
            "HTTP request completed",
            method=method,
            url=url,
            status_code=response.status_code,
            duration_seconds=round(duration, 3)
        )

        return response

    except Exception as e:
        duration = time.time() - start_time

        other_service_logger.error(
            "HTTP request failed",
            method=method,
            url=url,
            duration_seconds=round(duration, 3),
            error=str(e),
            error_type=type(e).__name__
        )
        raise


@invokable(session="session")
def demonstrate_logging_with_new_logger(agent, session, **kwargs):
    other_service_logger.info(f"Custom logging from my custom invokable API endpoint with variables: {kwargs}")
    try:
        integration_with_other_service("get", "https://my-service.com/health")
    except Exception:
        logger.error("Custom FN failed due to network outage!", extra={"traceback": traceback.format_exc()})