L7ESP K8s Monitoring with Grafana
Introduction
The Document below was created to give instruction to the DevOps support team to help them onboard the monitoring tool to enhance obervability across internal assets and customer assets.
Grafana Architecture
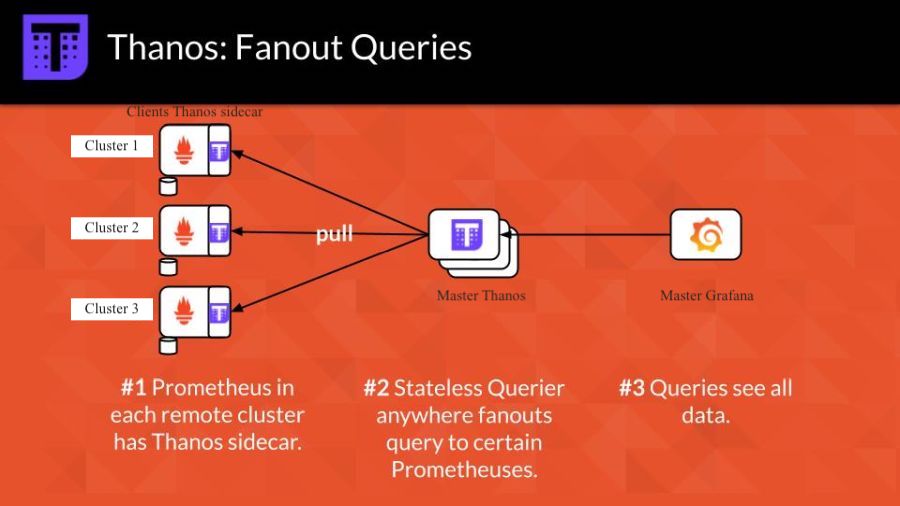
Grafana architecture (mutliple cluster monioring) will consist of one master thanos deployment at the master cluster with the grafana front end application, this master node will play as the single pane for monitoring. The client cluster will need a deployment of the thanos stack to ship metrics and log to the master cluster. In case the assets to be monitors are not on k8s, we will leverage the numerous datasource grafana provide to fetch metrics.

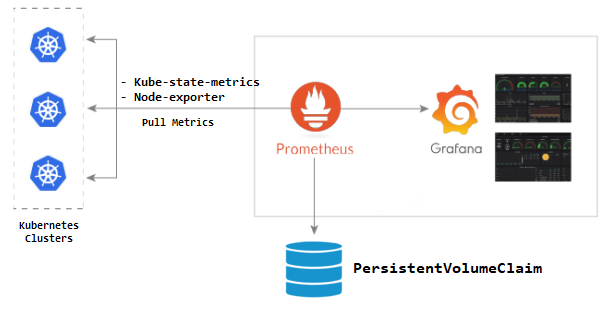
For a single cluster monitoring you can just leverage a prometheus agent scraping metrics from nodeexporter/kube state metrics on your nodes. Metrics are then shipped to grafana.

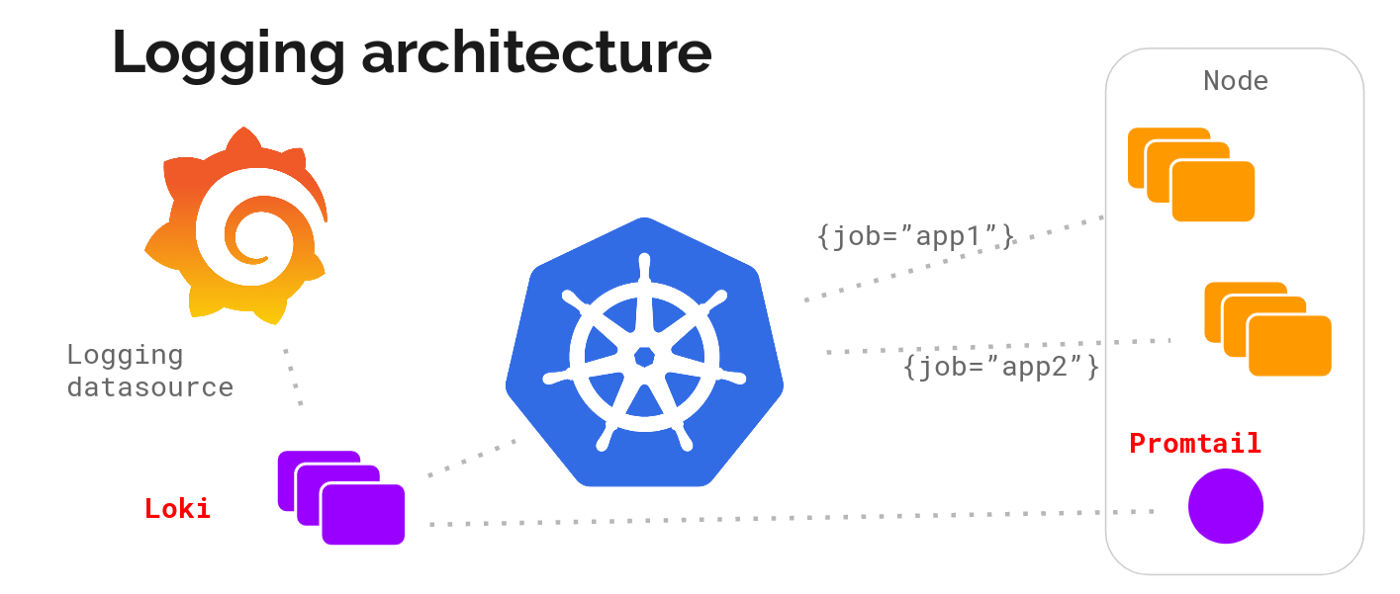
The logging of your application will be scraped and shipped to grafana by loki running jobs with promtail on the nodes to request logs from your k8s application.

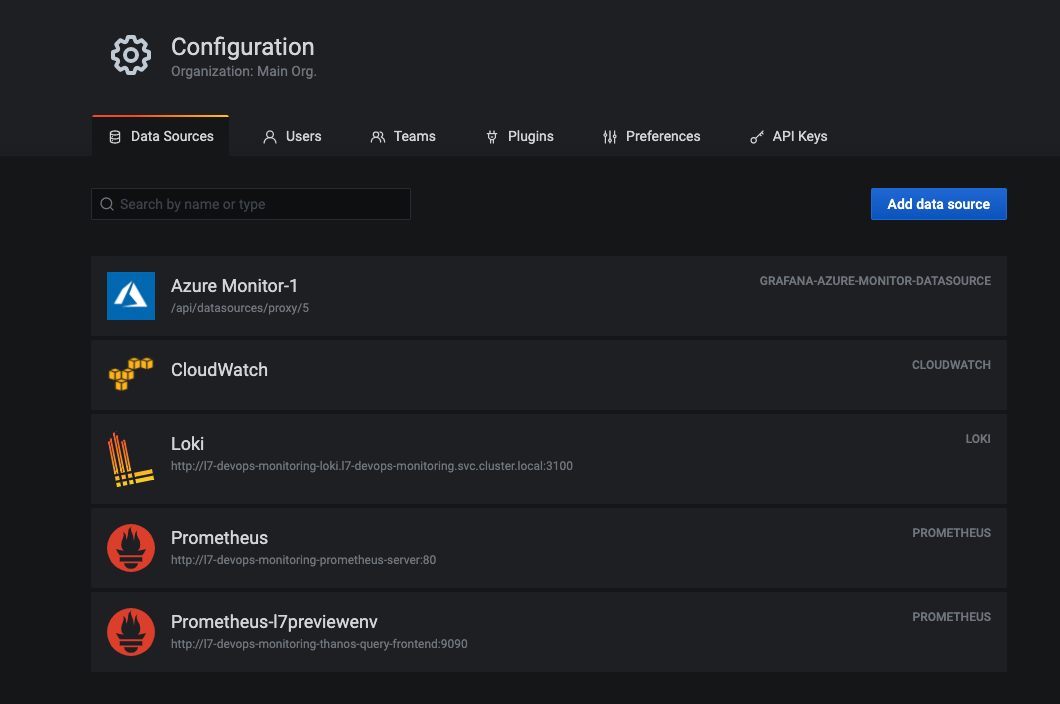
At last grafana can also leverage API datasources to fetch metrics from other assests, such as Azure or AWS cloud environment. This will be done through their datasources.

Requirements
To install the grafana stack, on your kubernetes cluster, you must have
Kubernetes cluster to deploy your helm charts.
The kubectl and helm command line tools will be use respectively to programmatically access the Kubernetes cluster and the AWS account. To install the CLI tools, follow the link below and choose the correct operating sytem:
Grafana
The Grafana application can be installed using the helm chart. Download the helm chart on your laptop from the following website: Grafana helm chart them install it using helm.
Following are values.yaml parameters to managed your dashboards in grafana.
Automated uploads of new dashboard so user can upload new dashboard.json on the data folder of your confimap. That folder lable should match the label on the values file specified below.
    dashboards:
      enabled: true
      SCProvider: true
      # label that the configmaps with dashboards are marked with
      label: grafana_dashboard
enable default dashboard at login by updating the following values parameters.
    dashboards:
      default_home_dashboard_path: /tmp/dashboards/k8s-dashboard.json
Set initial grafana login username and password
grafana:
  enabled: true
  # Pass values to Grafana child chart
  adminUser: admin
  adminPassword: admin
Datasource
Datasources are special back-end query API that query data from different assets. Below are a list of currently used data sources by ESP grafana.
blackboxexporter: A probe that leverages prometheus to check health and metrics from SSL certificates
thanos: High availability master-client architecture to scrape metrics from other clusters
prometheus: Time series data queryier for metrics
aws cloudwatch: Data source to ingest AWS cloudwatch data and logs
azure monitor: Data source to ingest Azure data and logs
Loki: Data source to ingest knative application logs.
Install datasources dependency helm charts
Datasources helm charts can be installed from the following websites: * Prometheus * prometheus-blackbox-exporter * Thanos * Loki * promtail
Values parameters configuration for each Datasources
Enable and configure each datasource from the values.yml:
configure prometheus
          url: http://{{ .Release.Name }}-prometheus-server:80
prometheus:
  server:
    extraArgs:
      log.level: debug
      storage.tsdb.min-block-duration: 2h  # Don't change this, see docs/components/sidecar.md
      storage.tsdb.max-block-duration: 2h  # Don't change this, see docs/components/sidecar.md
    retention: 4h
    service:
      annotations:
        prometheus.io/scrape: "true"
        prometheus.io/port: "9090"
    statefulSet:
      enabled: true
    podAnnotations:
      prometheus.io/scrape: "true"
      prometheus.io/port: "10902"
    affinity:
      podAntiAffinity:
        requiredDuringSchedulingIgnoredDuringExecution:
        - labelSelector:
            matchExpressions:
            - key: app
              operator: In
              values:
              - prometheus
            - key: component
              operator: In
              values:
              - server
          topologyKey: "kubernetes.io/hostname"
configure Thanos
          url: http://{{ .Release.Name }}-thanos-query-frontend:9090
thanos:
  objstoreConfig: |-
    type: s3
    config:
      bucket:
      endpoint:
      access_key:
      secret_key:
      insecure: true
  query:
    stores:
      -
      # - SIDECAR-SERVICE-IP-ADDRESS-2:10901
  bucketweb:
    enabled: true
  compactor:
    enabled: true
  storegateway:
    enabled: true
  ruler:
    enabled: true
    alertmanagers:
      - http://l7-devops-monitoring-prometheus-alertmanager.grafana.svc.cluster.local:9093
    config: |-
      groups:
        - name: "metamonitoring"
          rules:
            - alert: "PrometheusDown"
              expr: absent(up{prometheus="monitoring/prometheus-operator"})
configure prometheus-blackbox
    prometheus.yml:
      scrape_configs:
        - job_name: "healthchecks"
          scrape_interval: 60s
          scheme: https
          metrics_path: projects/446fab8e-5a9f-4f41-a90b-f086581f64a5/metrics/lthdUEmLy2xTIbPH5Jngrm_BPMGopHT7
          static_configs:
            - targets: ["healthchecks.io"]

        - job_name: 'kubernetes-pods'
          kubernetes_sd_configs:
          - role: pod

          relabel_configs:
          - source_labels: [__meta_kubernetes_pod_annotation_prometheus_io_scrape]
            action: keep
            regex: true
          - source_labels: [__meta_kubernetes_pod_annotation_prometheus_io_path]
            action: replace
            target_label: __metrics_path__
            regex: (.+)
          - source_labels: [__address__, __meta_kubernetes_pod_annotation_prometheus_io_port]
            action: replace
            regex: (.+):(?:\d+);(\d+)
            replacement: ${1}:${2}
            target_label: __address__
          - action: labelmap
            regex: __meta_kubernetes_pod_label_(.+)

        - job_name: "snykmetrics"
          static_configs:
            - targets: ["localhost:9090"]
            - targets: ["localhost:9532"]

        - job_name: 'blackbox'
          metrics_path: /probe
          params:
            module: [http_2xx]
          static_configs:
            - targets:
                    - https://clinops-stage.preview.l7esp.com
                    - https://stage.preview.l7esp.com
                    - https://250.preview.l7esp.com
                    - https://qa-clinops300.preview.l7esp.com
                    - https://preview.l7esp.com
                    - https://inspiring-jepsen-5082.edgestack.me
                    - https://lab7io.atlassian.net
                    - https://scipher-qa.l7esp.com
                    - https://cdn.l7esp.com
                    - https://lab7io.slack.com
                    - https://ci.l7informatics.com
                    - https://registry.l7informatics.com
                    - https://l7devopstest.azurecr.io
          relabel_configs:
            - source_labels: [__address__]
              target_label: __param_target
            - source_labels: [__param_target]
              target_label: instance
            - target_label: __address__
              replacement: l7-devops-monitoring-prometheus-blackbox-exporter:9115  # Blackbox exporter scraping address
configure loki/promtails
          url: http://{{ .Release.Name }}-loki.{{ .Release.Name }}.svc.cluster.local:3100
loki:
  enabled: true

promtail:
  enabled: true
      scrapeConfigs: |
        # See also https://github.com/grafana/loki/blob/master/production/ksonnet/promtail/scrape_config.libsonnet for reference

        # Pods with a label 'app.kubernetes.io/name'
        - job_name: kubernetes-pods-app-kubernetes-io-name
          pipeline_stages:
            {{- toYaml .Values.config.snippets.pipelineStages | nindent 4 }}
          kubernetes_sd_configs:
            - role: pod
          relabel_configs:
            - action: replace
              source_labels:
                - __meta_kubernetes_pod_label_app_kubernetes_io_name
              target_label: app
            - action: drop
              regex: ''
              source_labels:
                - app
            - action: replace
              source_labels:
                - __meta_kubernetes_pod_label_app_kubernetes_io_component
              target_label: component
            {{- if .Values.config.snippets.addScrapeJobLabel }}
            - action: replace
              replacement: kubernetes-pods-app-kubernetes-io-name
              target_label: scrape_job
            {{- end }}
            {{- toYaml .Values.config.snippets.common | nindent 4 }}
Azure monitor
        - name: Azure Monitor-1
          type: grafana-azure-monitor-datasource
          access: proxy
          jsonData:
            azureAuthType: clientsecret
            cloudName: azuremonitor
            tenantId:
            clientId:
            subscriptionId: l7 informatics
          secureJsonData:
            clientSecret:
          version: 1
AWS cloudwatch
        - name: CloudWatch
          type: cloudwatch
          jsonData:
            authType: keys
            defaultRegion: us-east-1a
          secureJsonData:
            accessKey: ''
            secretKey: ''